Industrial Properties
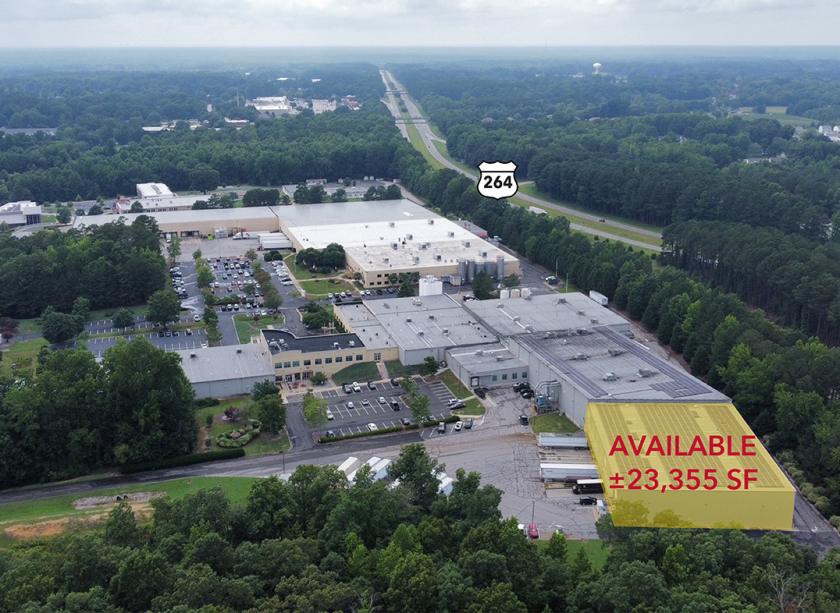
505 Innovative Way Zebulon, NC 27597
505 Innovative Way Zebulon, NC 27597
Details & Description
Property Highlights
- • Master lease expires on October 31, 2025
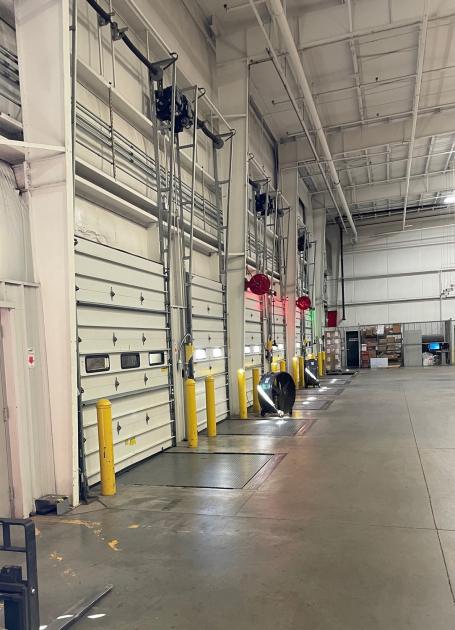
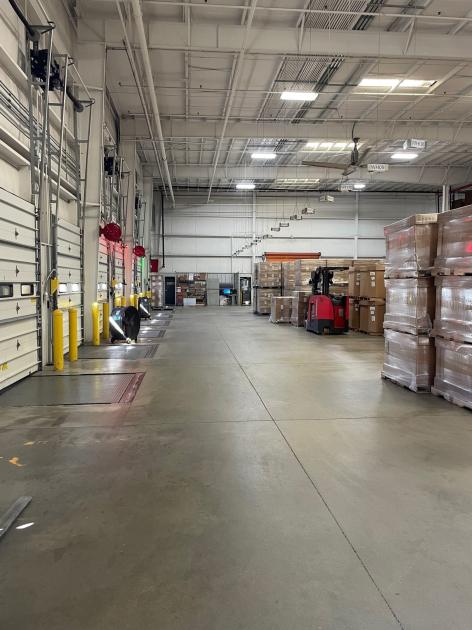
- • 27' Clear height
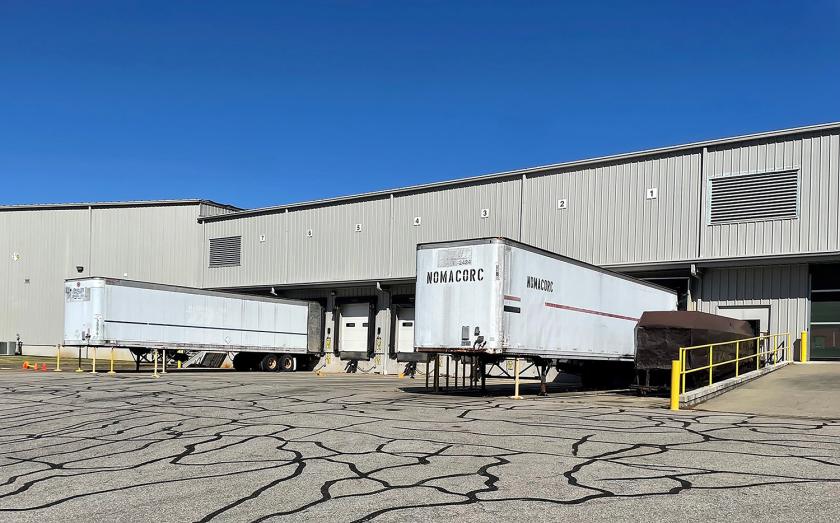
- • (7) Dock-high doors with door levelers
- • (1) Oversized ground loading door
- • (2) Restrooms
- • Small office area
Additional Photos


Listing Agents

Ryan Lawler
O: 919-576-2511
M: 949-291-3896
rlawler@lee-associates.com
O: 919-576-2511
M: 949-291-3896
rlawler@lee-associates.com

Moss Withers
O: 919-576-2501
M: 919-810-2492
mwithers@lee-associates.com
O: 919-576-2501
M: 919-810-2492
mwithers@lee-associates.com
While we strive to provide the most accurate information, all listing information, and demographic data, is provided by third-parties. As such, MyEListing will not be responsible for the accuracy of the information. It is strongly recommended that you verify all information with the listing agent, and any relevant agencies, prior to making any decisions.