Commercial Land
475 Oak Tree Drive Selma, NC 27576
475 Oak Tree Drive Selma, NC 27576
Details & Description
Property Highlights
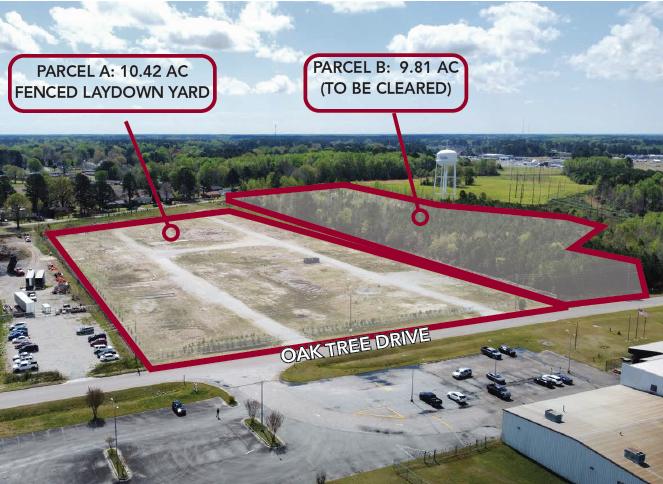
- • Parcel A - 10.42 Acre fenced laydown yard
- • Parcel B - 9.81 Acres (to be cleared)
- • Zoned industrial
Additional Photos


Listing Agents

Ryan Lawler
O: 919-576-2511
M: 949-291-3896
rlawler@lee-associates.com
O: 919-576-2511
M: 949-291-3896
rlawler@lee-associates.com

Will Judy
O: 919-576-2513
M: 919-606-1956
wjudy@lee-associates.com
O: 919-576-2513
M: 919-606-1956
wjudy@lee-associates.com
While we strive to provide the most accurate information, all listing information, and demographic data, is provided by third-parties. As such, MyEListing will not be responsible for the accuracy of the information. It is strongly recommended that you verify all information with the listing agent, and any relevant agencies, prior to making any decisions.


