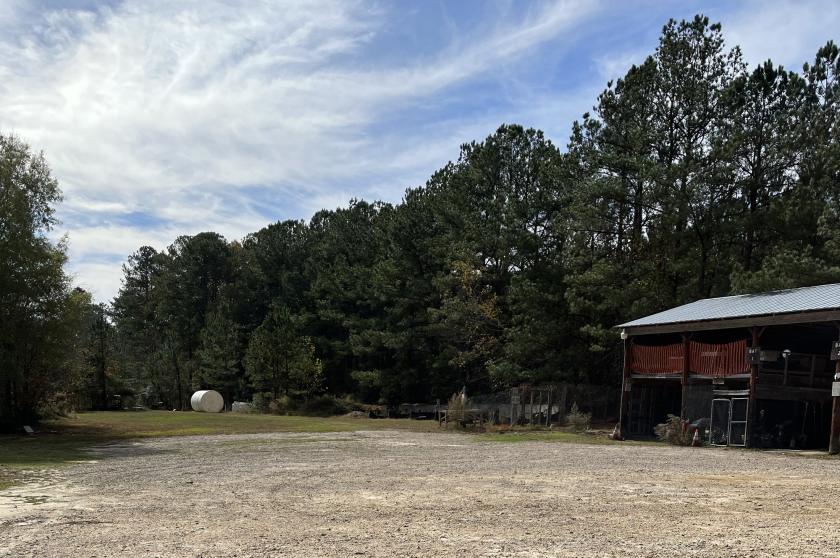
Commercial Land
9224 Dukes Lake Road Zebulon, NC 27597
9224 Dukes Lake Road Zebulon, NC 27597

Details & Description
Property Highlights
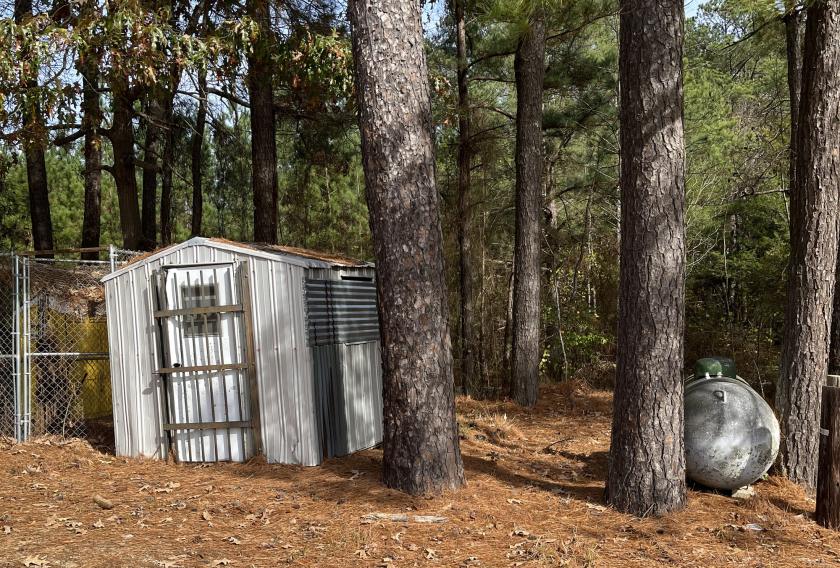
- • Security fenced perimeter
- • Onsite well, diesel, gas, and propane tanks
- • 6 bay covered storage onsite
Additional Photos


Listing Agents

Russell Stewart
O: 919-576-2506
M: 919-909-9779
rstewart@lee-associates.com
O: 919-576-2506
M: 919-909-9779
rstewart@lee-associates.com
While we strive to provide the most accurate information, all listing information, and demographic data, is provided by third-parties. As such, MyEListing will not be responsible for the accuracy of the information. It is strongly recommended that you verify all information with the listing agent, and any relevant agencies, prior to making any decisions.


