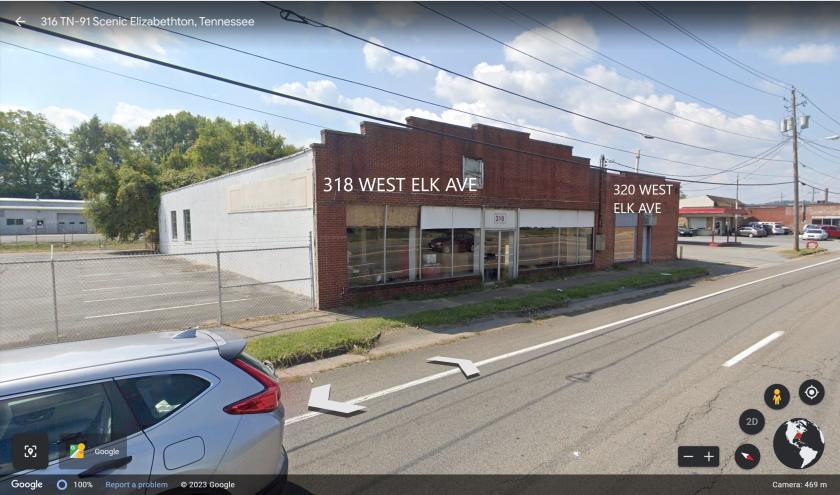
Retail Space
320 West Elk Avenue Elizabethton, TN 37643
320 West Elk Avenue Elizabethton, TN 37643

Details & Description
Property Highlights
• New "Center Turning Lane" to be completed in the next 12 months which will increase accessability to site
• Borders famous "Tweetsie" Rail Trail wwhich is a popular tourism attraction
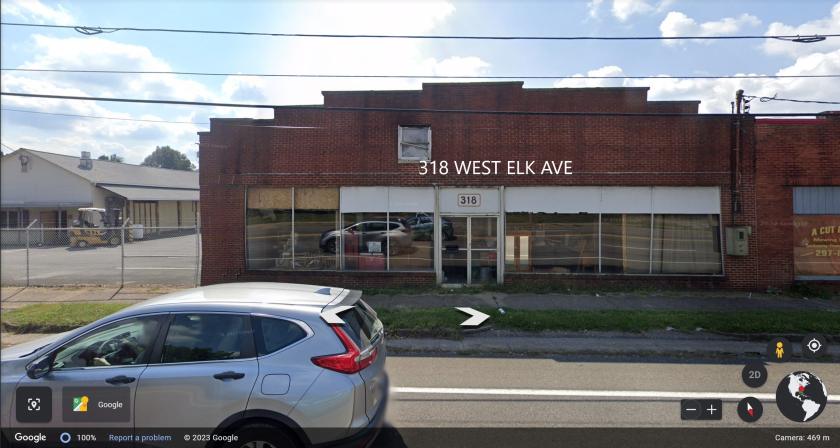
Additional Photos

Listing Agents

Peter Malone
O: 865-299-6280
M: 615-554-2079
peter.malone@marcusmillichap.com
O: 865-299-6280
M: 615-554-2079
peter.malone@marcusmillichap.com
While we strive to provide the most accurate information, all listing information, and demographic data, is provided by third-parties. As such, MyEListing will not be responsible for the accuracy of the information. It is strongly recommended that you verify all information with the listing agent, and any relevant agencies, prior to making any decisions.


