Office Space
Holly Springs Rd and Bass Lake Rd Holly Springs, NC 27540
Holly Springs Rd and Bass Lake Rd Holly Springs, NC 27540
Details & Description
Property Highlights
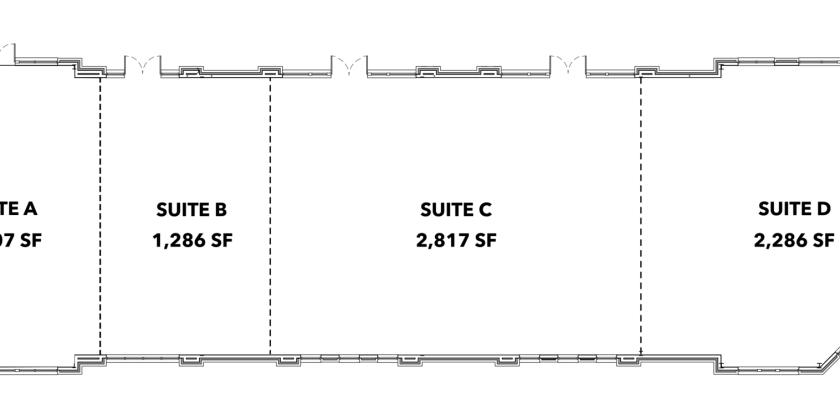
- • Pre-leasing Office and Retail Space
- • Lease Terms: 5 – 10 years
- • Tenant Improvement Allowance available
- • 4/1000 parking ratio
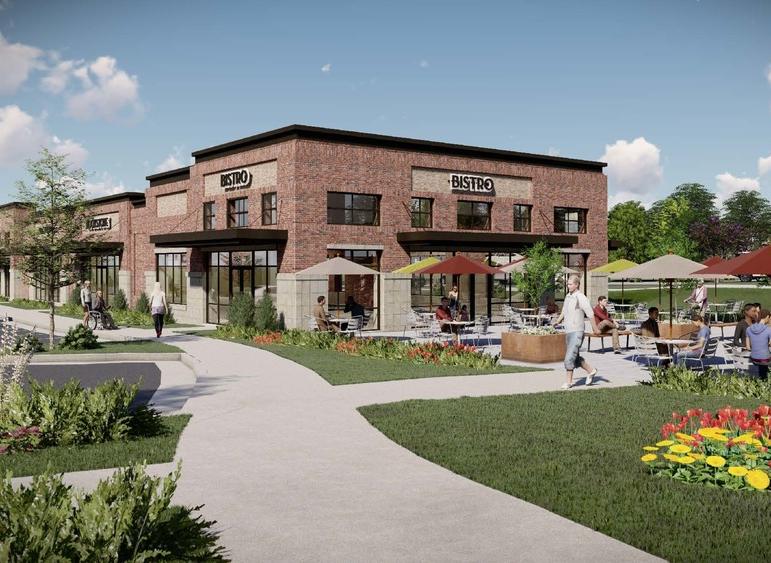
Additional Photos


Listing Agents

Jenn Olevitch-Roberson
O: 919-576-2517
M: 919-345-1752
jolevitch-roberson@lee-associates.com
O: 919-576-2517
M: 919-345-1752
jolevitch-roberson@lee-associates.com
While we strive to provide the most accurate information, all listing information, and demographic data, is provided by third-parties. As such, MyEListing will not be responsible for the accuracy of the information. It is strongly recommended that you verify all information with the listing agent, and any relevant agencies, prior to making any decisions.