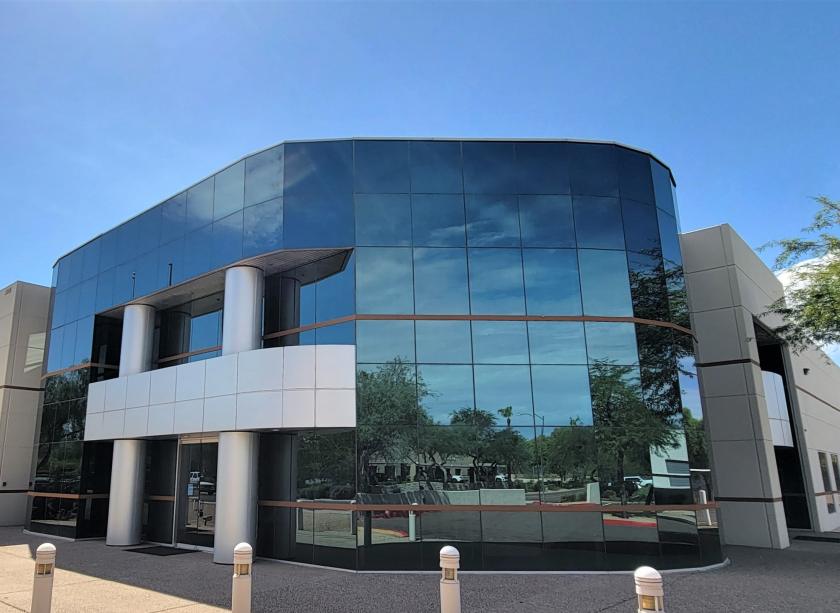
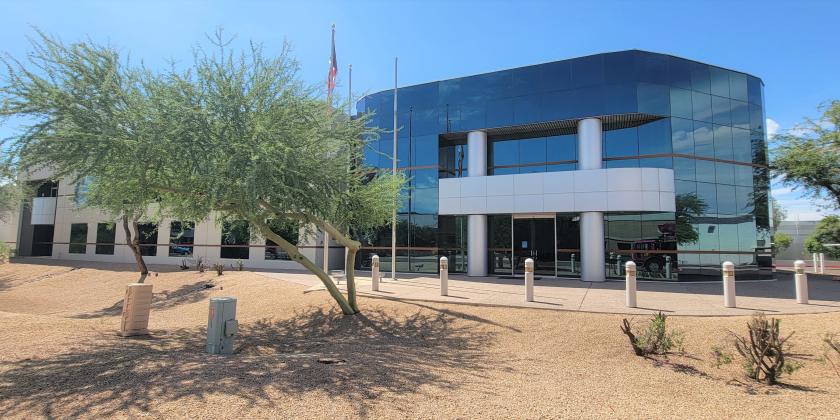
64,560 SF, 2-story industrial flex office/warehouse building is vacant and now available for sale at North Scottsdale Airpark.
The 24,560 SF office buildout includes 1 large reception area, 1 large executive office (w/private access to own kitchen and full bathroom) 17 offices, 6 storage closets, 3 kitchen/breakrooms, 10 open cubicle work rooms (potential conference rooms), 4 kitchen/break rooms, 2 storage/copy rooms, 2 power access rooms, 1 data/server room, and 11 restrooms.
The 40,000 SF Warehouse space includes 5,000 SF of the warehouse space and 2,320 SF production area with A/C. EVAP warehouse side is HVAC capable, includes a double truck well; Five 12'x14' grade-level doors, and 18' - 20' clear height. Conveniently heavily powered with 1,600 AMP, 277/480V.
Parking: 163 total parking spaces (36 covered)
18' - 20' clear height
Power: 1,600 Amps, 277/480V
Double truckwell
Five 12'x14' grade level doors
Lucrative Scottsdale location surrounded by fast-growing commercial/residential developments:
Proximity to Northern Phoenix and the new $12 billion Taiwan Semiconductor Plant (TSMC) currently under development, bringing a hive of construction activity & potential for new supporting business investments.
Nearby CrackerJax family fun center land which has sold and is soon transforming to a 1.9 million SF mixed-use campus - a catalyst to attract top innovators, technology entrepreneurs, knowledge workers, and venture capitalists to accelerate Scottsdale’s growing technology cluster!
Conveniently accessible with less than 2 miles from AZ State Route 101
Minutes from the airport, major shopping centers like Kierland Commons & Scottsdale Quarters
Minutes from popular restaurants like Postino, The Cheesecake Factory, Shake Shack, and more!