Industrial Properties
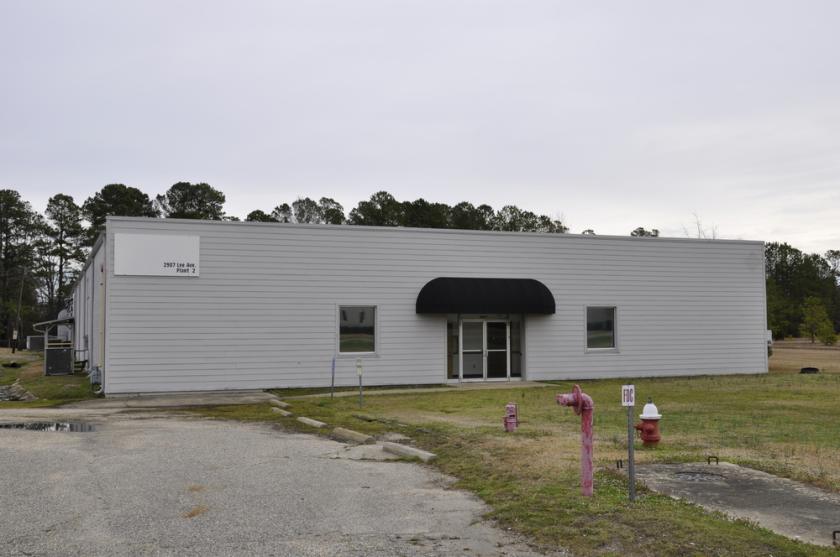
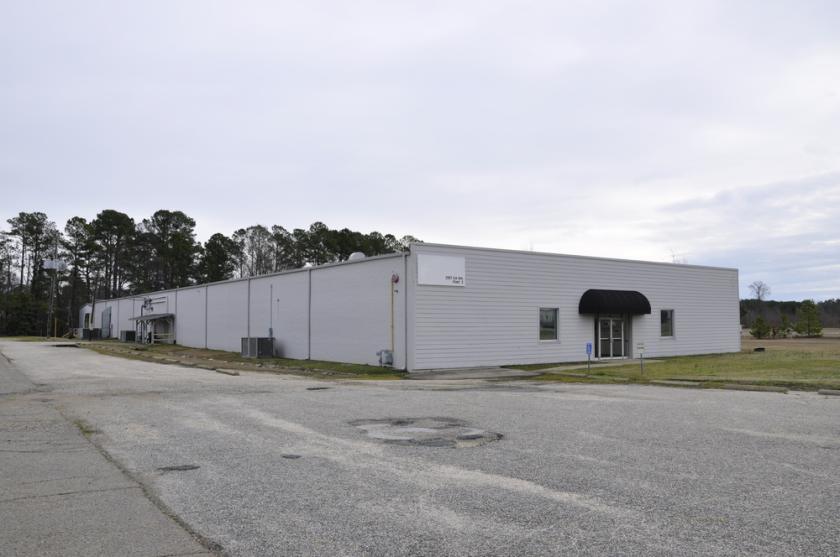
2907 Lee Avenue Sanford, NC 27332
2907 Lee Avenue Sanford, NC 27332

Details & Description
Property Highlights
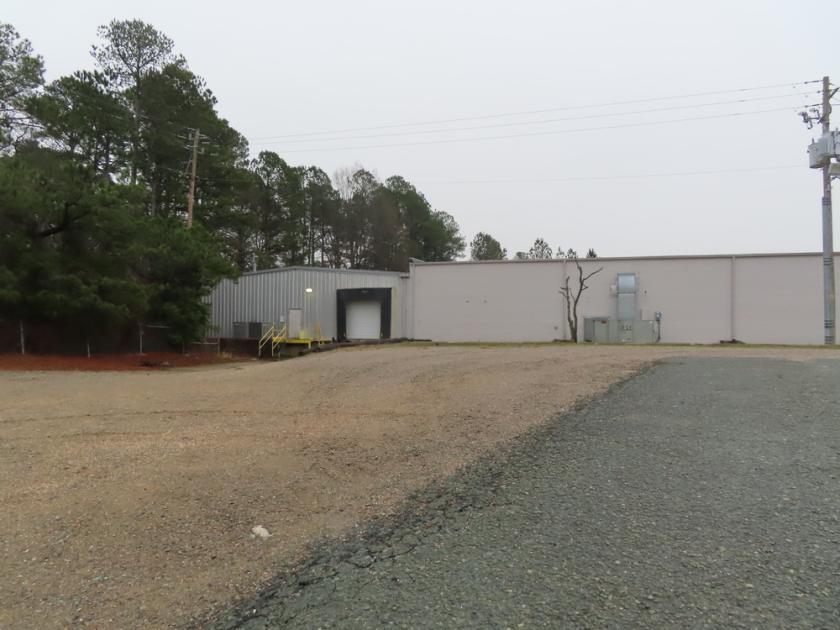
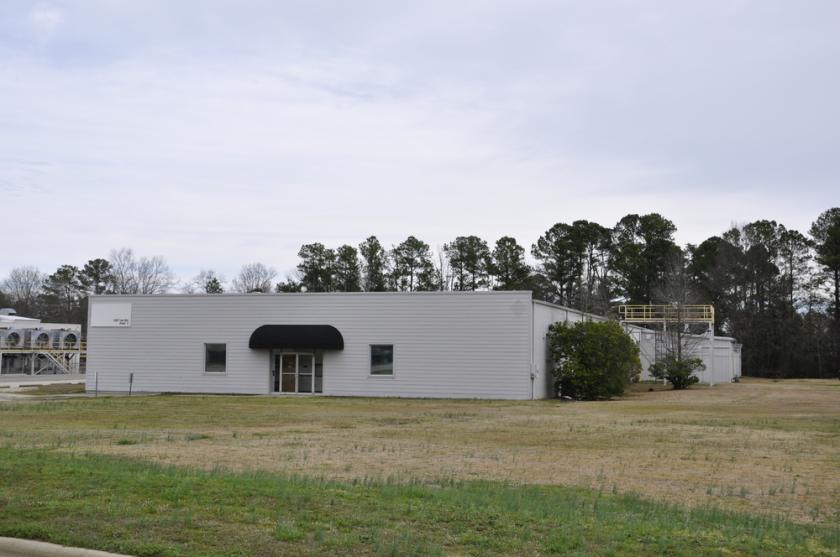
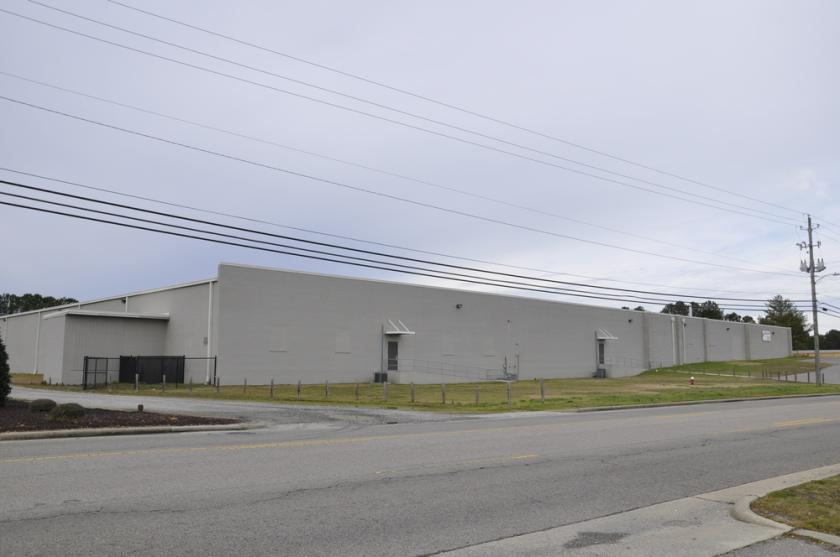
- • 25,754 SF Warehouse on 4.46 Acres
- • Zoned LI
- • Ceiling height 14'
- • 800 AMP, 3-Phase Power
- • Small Office Area in front of building
- • Extra land for parking or truck storage/yard space
Additional Photos
Listing Agents

Hunter Stewart
O: 919-576-2507
M: 919-548-3172
hstewart@lee-associates.com
O: 919-576-2507
M: 919-548-3172
hstewart@lee-associates.com

Scott Hadley
O: 919-576-2504
M: 919-906-0524
shadley@lee-associates.com
O: 919-576-2504
M: 919-906-0524
shadley@lee-associates.com
While we strive to provide the most accurate information, all listing information, and demographic data, is provided by third-parties. As such, MyEListing will not be responsible for the accuracy of the information. It is strongly recommended that you verify all information with the listing agent, and any relevant agencies, prior to making any decisions.