Retail Space
1258 North Brightleaf Boulevard Smithfield, NC 27577
1258 North Brightleaf Boulevard Smithfield, NC 27577
Details & Description
Property Highlights
• Applebee’s, Hardee’s, Lowe’s Home Improvement and Murphy Express occupy adjoining outparcels
• Located near the intersection of N. Brightleaf Blvd. and E. Booker Dairy Rd.
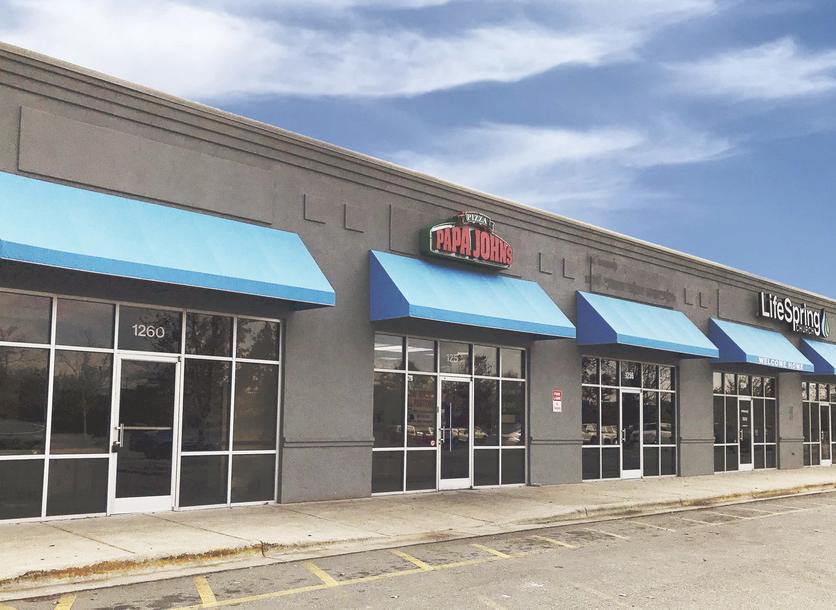
Additional Photos


Listing Agents

Grier Godwin
Lee and Associates
O: 919-591-2272
M: 919-524-5407
ggodwin@lee-associates.com
Lee and Associates
O: 919-591-2272
M: 919-524-5407
ggodwin@lee-associates.com
While we strive to provide the most accurate information, all listing information, and demographic data, is provided by third-parties. As such, MyEListing will not be responsible for the accuracy of the information. It is strongly recommended that you verify all information with the listing agent, and any relevant agencies, prior to making any decisions.


