Commercial Land
Chatham Drive NW Ocean Isle Beach, NC 28469
Chatham Drive NW Ocean Isle Beach, NC 28469
Details & Description
Property Highlights
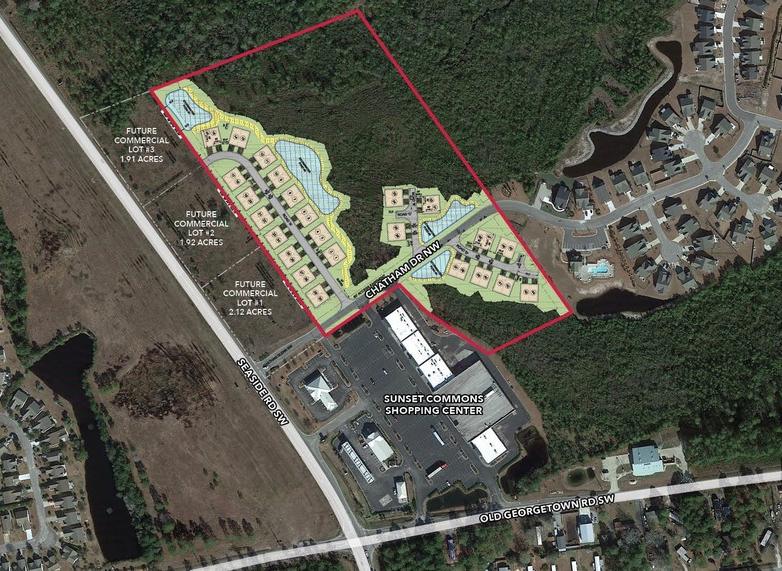
- • Fully approved plans show up to 48 duplex units
- • Grading permit in hand
- • Brunswick County PIN: 2270002308
Listing Agents

Dan Koeller
Lee and Associates
O: 919-591-2274
M: 919-349-7857
dkoeller@lee-associates.com
Lee and Associates
O: 919-591-2274
M: 919-349-7857
dkoeller@lee-associates.com
While we strive to provide the most accurate information, all listing information, and demographic data, is provided by third-parties. As such, MyEListing will not be responsible for the accuracy of the information. It is strongly recommended that you verify all information with the listing agent, and any relevant agencies, prior to making any decisions.


