Industrial Properties
151 West Avenue Lyndonville, NY 14098
151 West Avenue Lyndonville, NY 14098

Details & Description
Property Highlights
- • Centrally Located
- • Flexible Lease Terms
- • 8 Truck Docks - 4 Grade Level Doors
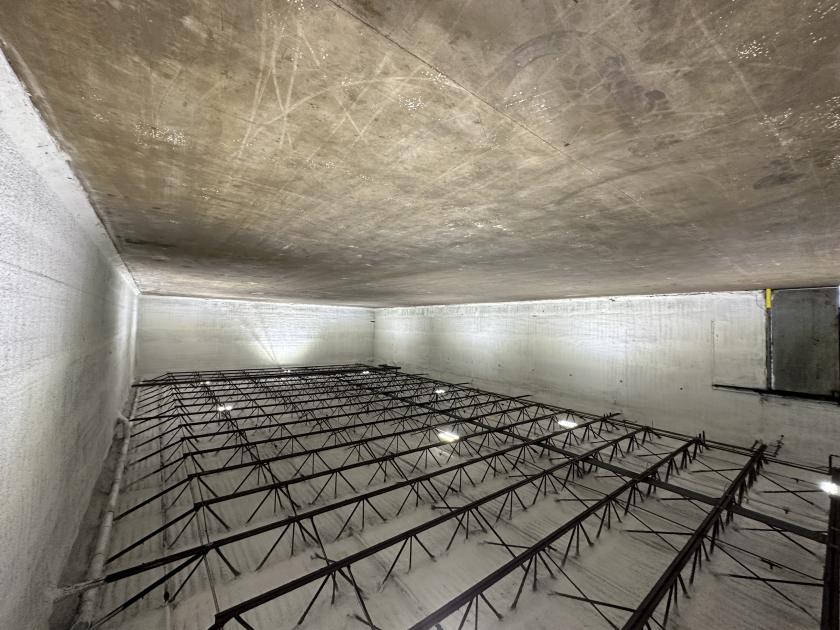
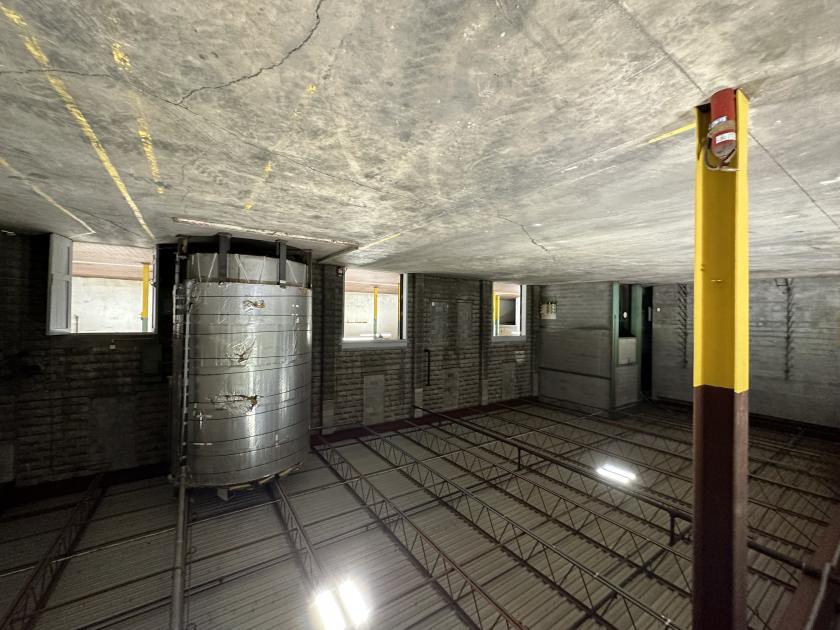
- • Cold Storage Availability
- • Ceiling Height: 10' up to 30'
- • Building Can Be Separated Into Multiple Sections
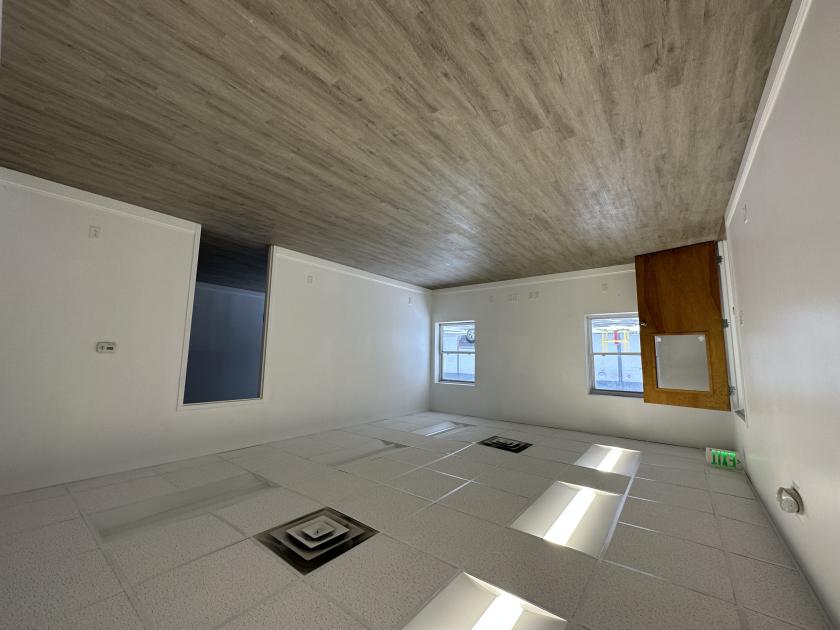
Additional Photos


Listing Agents

Rick Recckio
O: 716-631-5555
M: 716-998-4422
rick@recckio.com
O: 716-631-5555
M: 716-998-4422
rick@recckio.com
While we strive to provide the most accurate information, all listing information, and demographic data, is provided by third-parties. As such, MyEListing will not be responsible for the accuracy of the information. It is strongly recommended that you verify all information with the listing agent, and any relevant agencies, prior to making any decisions.