Specialty Real Estate
313 North Evans Street Tecumseh, MI 49286
313 North Evans Street Tecumseh, MI 49286

Details & Description
Property Highlights
• 200 Chavari chairs - 30 tables round and rectangle wood and steel
• Capacity 350 Main Hall 200 and Rustic Hall 150
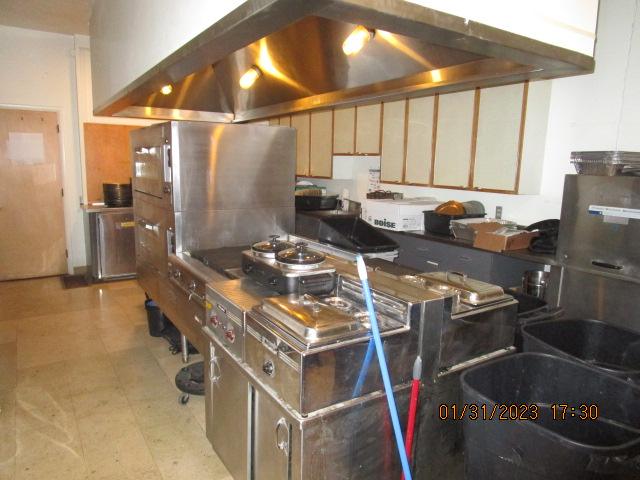
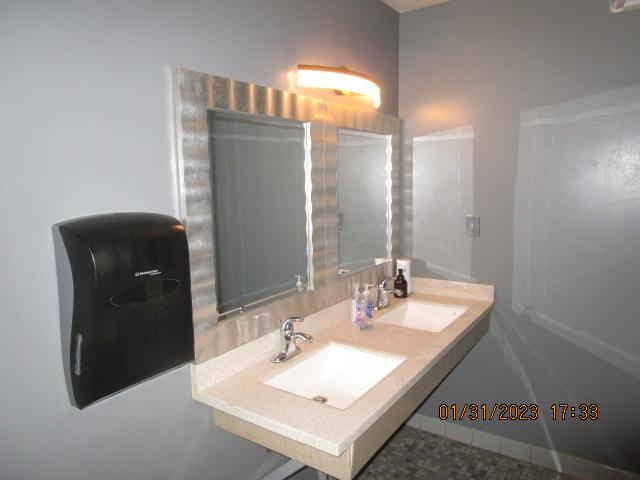
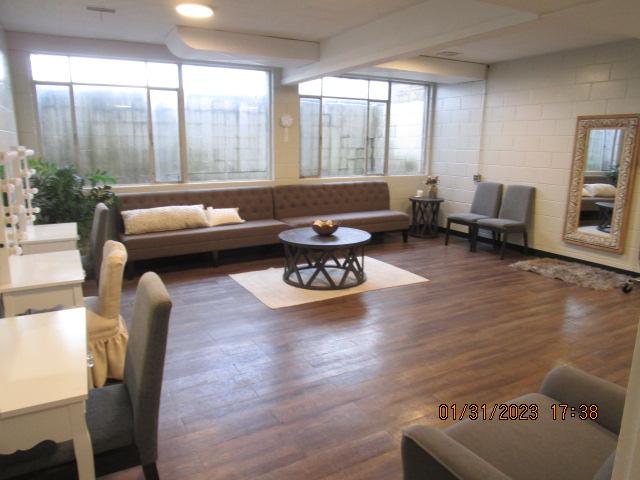
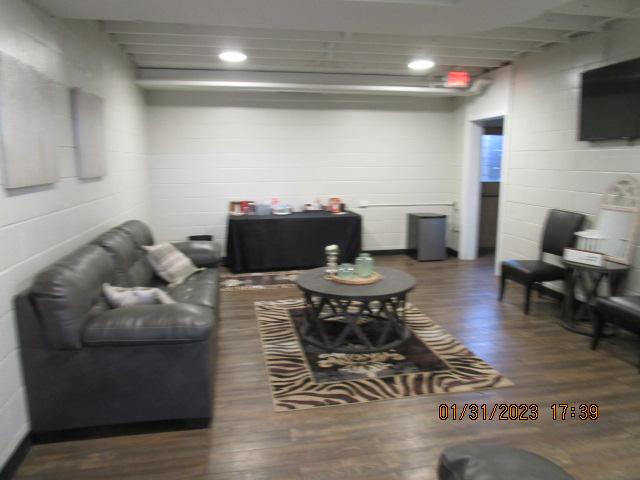
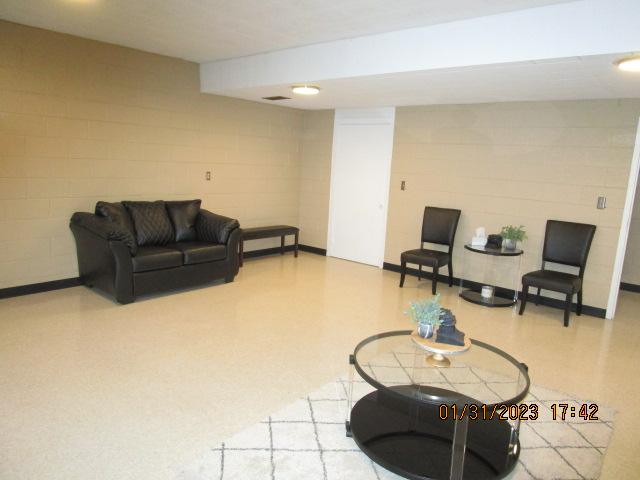
Additional Photos


Listing Agents

Patrick Hoffman
O: 248-342-4604
patrickhoffman@hannacre.com
O: 248-342-4604
patrickhoffman@hannacre.com
While we strive to provide the most accurate information, all listing information, and demographic data, is provided by third-parties. As such, MyEListing will not be responsible for the accuracy of the information. It is strongly recommended that you verify all information with the listing agent, and any relevant agencies, prior to making any decisions.