Office Space
8 Copley Parkway Morrisville, NC 27560
8 Copley Parkway Morrisville, NC 27560

Details & Description
Property Highlights
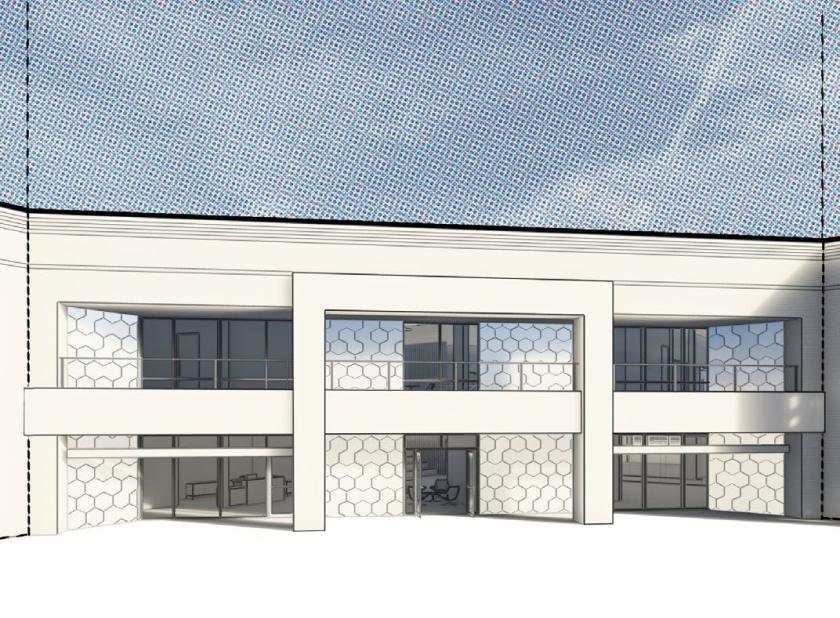
- • Proposed 2-story laboratory & office
- • Up to 80,000 SF available
- • Building signage visible from I-40
- • Private, wooded site
- • Parking ratio 3:1,000 SF
- • Property being rezoned to BAC
Additional Photos


Listing Agents

Brian Farmer
O: 919-576-2503
M: 919-730-6584
bfarmer@lee-associates.com
O: 919-576-2503
M: 919-730-6584
bfarmer@lee-associates.com
While we strive to provide the most accurate information, all listing information, and demographic data, is provided by third-parties. As such, MyEListing will not be responsible for the accuracy of the information. It is strongly recommended that you verify all information with the listing agent, and any relevant agencies, prior to making any decisions.


