Office Space
224 Main Street Nevada City, CA 95959
224 Main Street Nevada City, CA 95959

Details & Description
Property Highlights
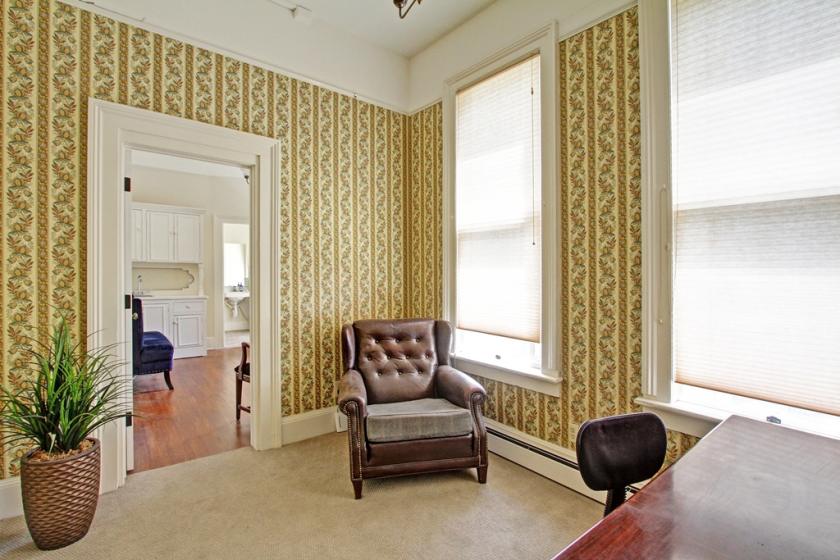
- • Beautifully renovated professional office building
- • Historic downtown Nevada City
- • Spectacular Court House & downtown views
Listing Agents

Lock Richards
O: 530-470-1740
lock@highlandcre.com
O: 530-470-1740
lock@highlandcre.com
While we strive to provide the most accurate information, all listing information, and demographic data, is provided by third-parties. As such, MyEListing will not be responsible for the accuracy of the information. It is strongly recommended that you verify all information with the listing agent, and any relevant agencies, prior to making any decisions.