Industrial Properties
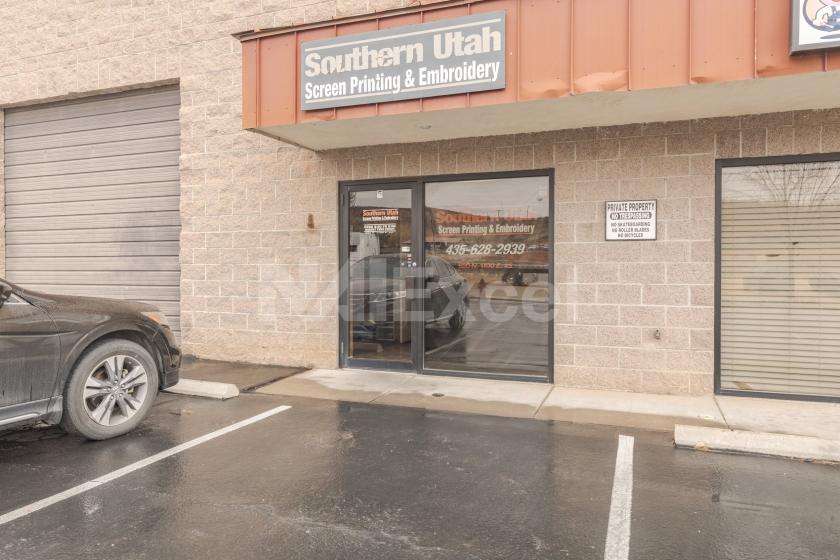
620 North 1100 East Street St George, UT 84770
620 North 1100 East Street St George, UT 84770

Details & Description
Property Highlights
• Business & Real Estate can be purchased together or separately
• Great Location
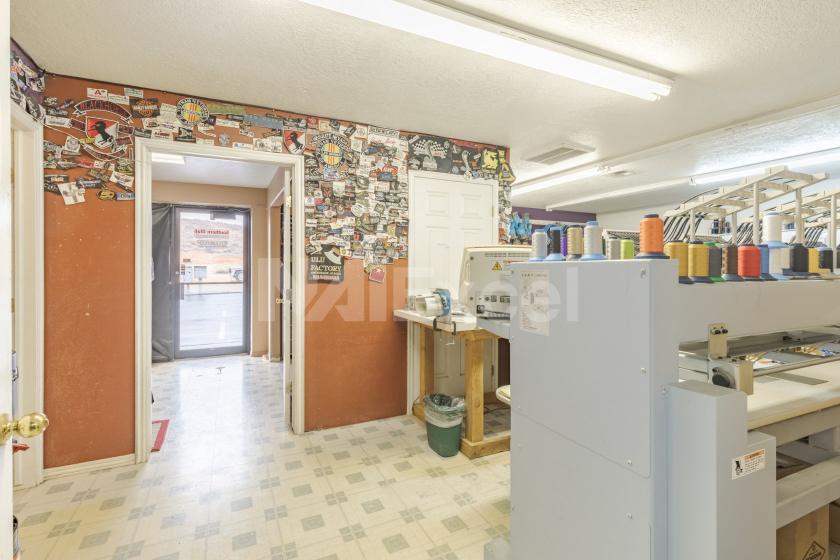
Additional Photos


Listing Agents

Wes Davis
NAI Excel
O: 435-627-5705
wdavis@naiexcel.com
NAI Excel
O: 435-627-5705
wdavis@naiexcel.com
While we strive to provide the most accurate information, all listing information, and demographic data, is provided by third-parties. As such, MyEListing will not be responsible for the accuracy of the information. It is strongly recommended that you verify all information with the listing agent, and any relevant agencies, prior to making any decisions.


