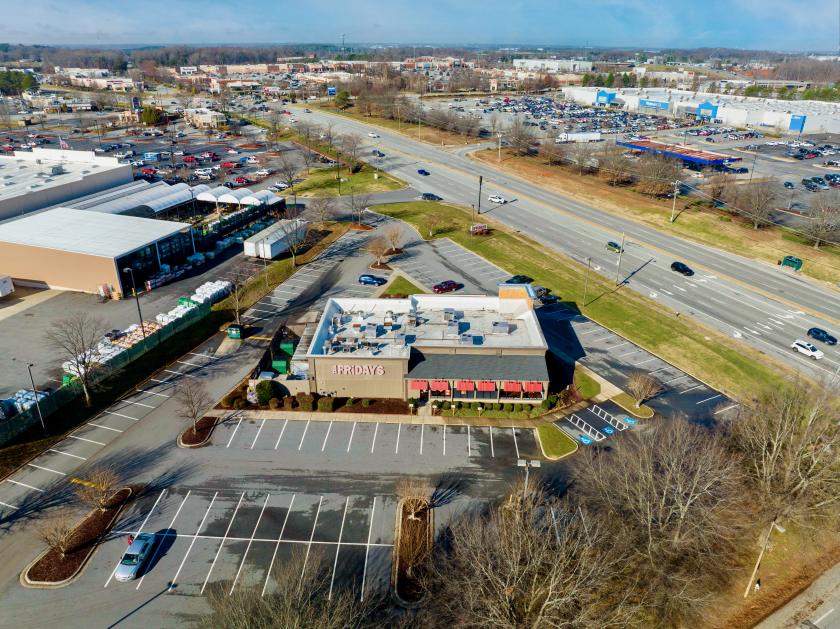
Retail Space
4423 West Wendover Avenue Greensboro, NC 27407
4423 West Wendover Avenue Greensboro, NC 27407

Details & Description
Property Highlights
- • Over 10 Years Remaining and Annual Rent Bumps
- • Second Largest TGI Fridays Franchisee
- • Long Term Established National Tenant
- • Annual Sales Reporting
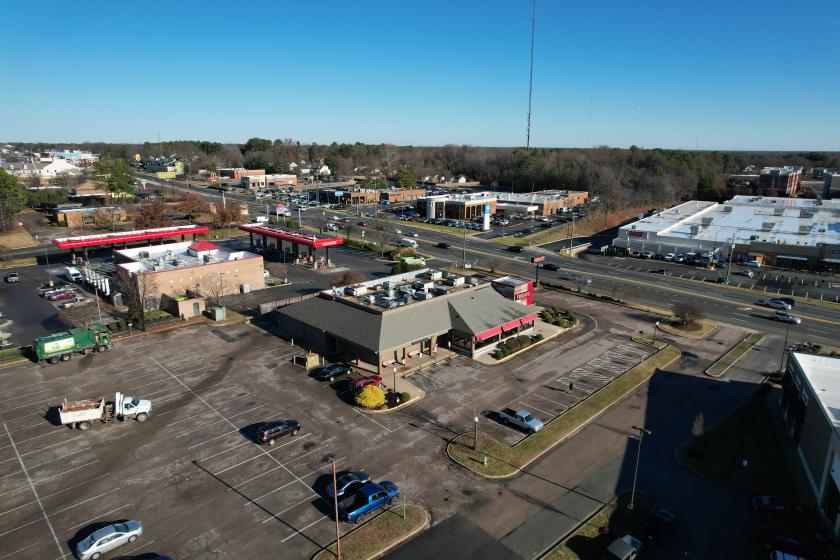
Additional Photos


Listing Agents

Brian Brisky
O: 612-413-4200
M: 715-529-4441
info@brisky.com
O: 612-413-4200
M: 715-529-4441
info@brisky.com
While we strive to provide the most accurate information, all listing information, and demographic data, is provided by third-parties. As such, MyEListing will not be responsible for the accuracy of the information. It is strongly recommended that you verify all information with the listing agent, and any relevant agencies, prior to making any decisions.