Retail Space
2112 Pease Street Houston, TX 77003
2112 Pease Street Houston, TX 77003
Details & Description
Property Highlights
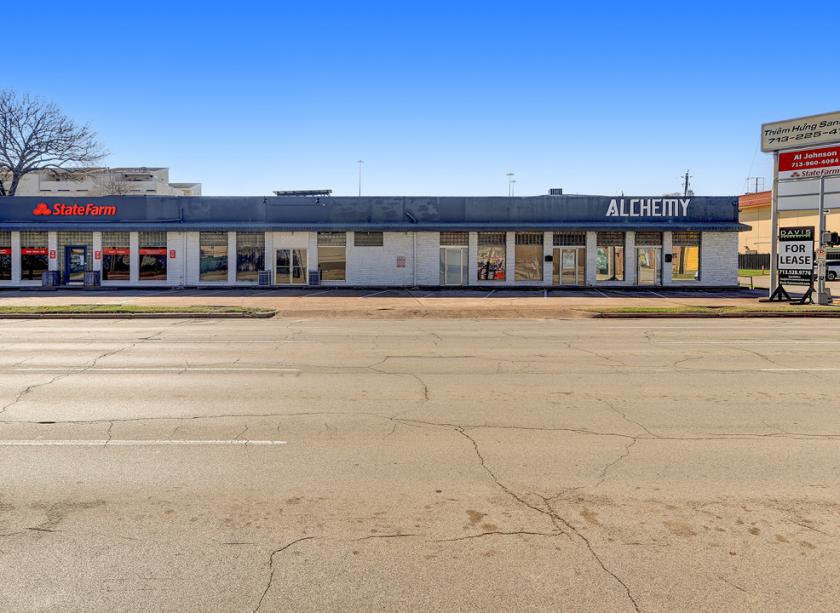
- • Multi-Tenant Property In the Heart of EADO
- • 17 Parking Spots
- • Lit Multi-Tenant Pylon Sign
Additional Photos


Listing Agents

Lisa Rimkus
O: 281-501-1725
lisa@davis-commercial.com
O: 281-501-1725
lisa@davis-commercial.com
While we strive to provide the most accurate information, all listing information, and demographic data, is provided by third-parties. As such, MyEListing will not be responsible for the accuracy of the information. It is strongly recommended that you verify all information with the listing agent, and any relevant agencies, prior to making any decisions.


