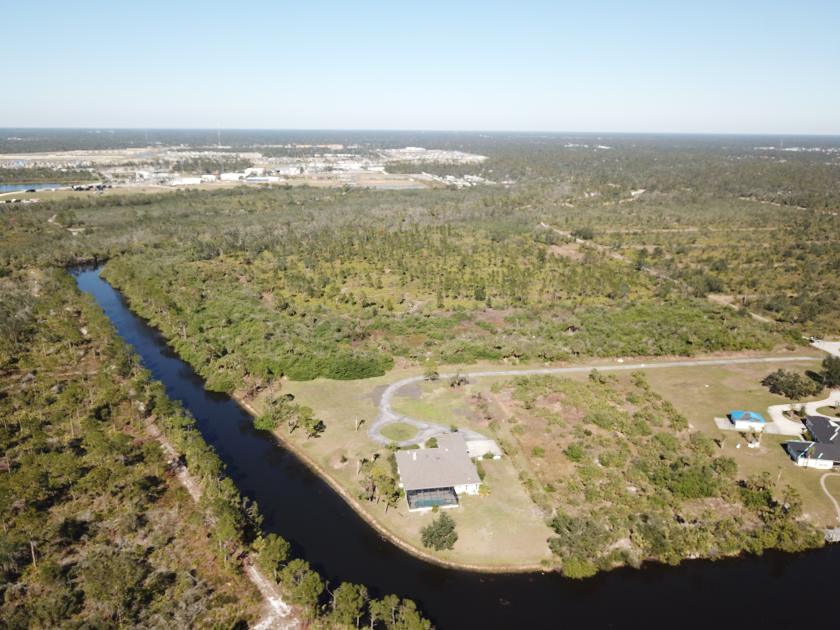
1-Mile | 3-Miles | 5-Miles | ||
---|---|---|---|---|
Total Population | 1,069 | 17,220 | 66,837 | |
Population Median Age | 54 | 52 | 50 | |
Population by Age | 0-9 Yrs | 30 (2%) | 1156 (6%) | 5703 (8%) |
10-19 Yrs | 114 (10%) | 1404 (8%) | 5111 (7%) | |
20-29 Yrs | 86 (8%) | 1399 (8%) | 5307 (7%) | |
30-39 Yrs | 7 (0%) | 1151 (6%) | 5786 (8%) | |
40-49 Yrs | 55 (5%) | 1472 (8%) | 6164 (9%) | |
50-59 Yrs | 132 (12%) | 2172 (12%) | 8899 (13%) | |
60-69 Yrs | 466 (43%) | 4111 (23%) | 13194 (19%) | |
70+ Yrs | 179 (16%) | 4354 (25%) | 16674 (24%) | |
Median HH Income | $54,680 | $52,672 | $52,330 | |
Total Household Income | < 24K | 102 (22%) | 1230 (17%) | 5118 (19%) |
25-49K | 41 (9%) | 1975 (28%) | 7572 (28%) | |
50-74K | 236 (52%) | 1771 (25%) | 5859 (21%) | |
75-99K | 11 (2%) | 665 (9%) | 3092 (11%) | |
100-199K | 52 (11%) | 1094 (15%) | 4368 (16%) | |
200K+ | 11 (2%) | 160 (2%) | 769 (2%) | |
Highest Education Level | No Diploma | 23 | 1462 | 5657 |
Diploma or GED | 315 | 4866 | 18168 | |
Some College | 359 | 3579 | 13551 | |
Assoc. Degree | 80 | 1501 | 5162 | |
Bachelors Degree | 93 | 1848 | 6978 | |
Higher Degree | 41 | 937 | 4072 | |
Total Housing Units | 555 | 8,434 | 33,338 | |
--Owner-Occupied | 439 | 5,791 | 21,796 | |
--Renter-Occupied | 15 | 1,104 | 4,982 | |
Owner-Occupied Values | < 100K | 6 | 811 | 2839 |
100-199K | 74 | 1898 | 8797 | |
200-299K | 169 | 1832 | 6568 | |
300-399K | 187 | 908 | 2090 | |
400-499K | 1 | 176 | 739 | |
500K+ | 0 | 164 | 763 | |
Total Working Age Population | 960 | 15,204 | 58,246 | |
In Work Force | 471 | 6,943 | 26,638 | |
Not In Work Force | 489 | 8,261 | 31,607 | |
Workforce Employed | 453 | 6,298 | 24,885 | |
Workforce Unemployed | 17 | 632 | 1,728 | |
Civlian Workforce | 470 | 6,930 | 26,612 | |
Military Workforce | 1 | 13 | 26 | |
Total Households | 453 | 6,894 | 26,778 | |
Family Households | 338 | 4,652 | 17,784 | |
Non-Family Households | 115 | 2,242 | 8,995 | |
Married Couple | 297 | 3,607 | 14,574 | |
Other Family | 41 | 1,045 | 3,209 | |
Married w/Child | 48 | 571 | 2,757 | |
Single Male w/Child | 0 | 101 | 480 | |
Single Female w/Child | 4 | 337 | 843 |
Population Change Last Two Decades - Plus Projection
2000 | % | 2010 | % | 2020 | % | 2030 | |
---|---|---|---|---|---|---|---|
Florida | 15,982,378 | +18 | 18,801,310 | +14 | 21,517,610 | +13 | 24,340,457 |
Charlotte County | 141,627 | +13 | 159,978 | +15 | 183,728 | +12 | 206,145 |
Sarasota County | 325,957 | +16 | 379,448 | +14 | 431,147 | +12 | 484,314 |
Total Working Age Population:
Total Households:
Total Working Age Population:
Total Households:
Total Working Age Population:
Total Households: