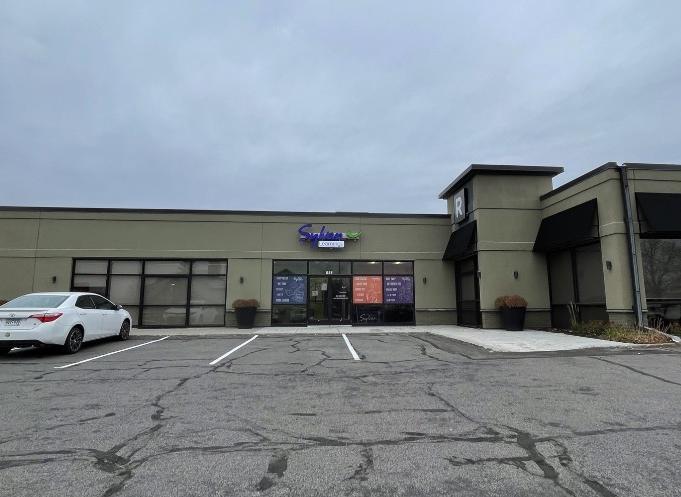
Retail Space
1913 County Highway 36 Saint Paul, MN 55106
1913 County Highway 36 Saint Paul, MN 55106
Details & Description
Property Highlights
- • Sublease
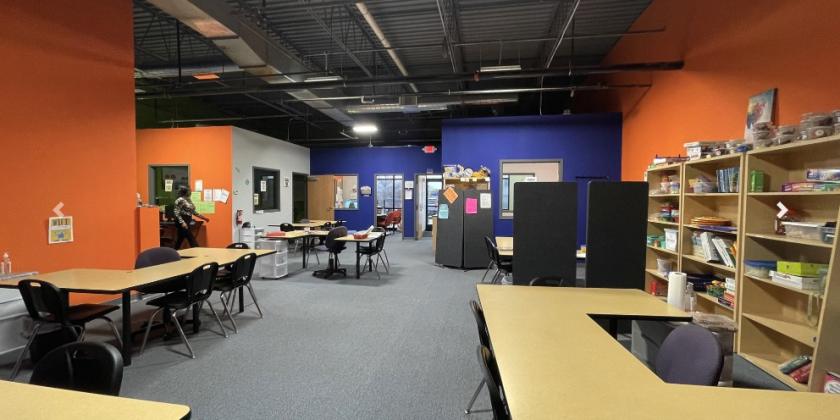
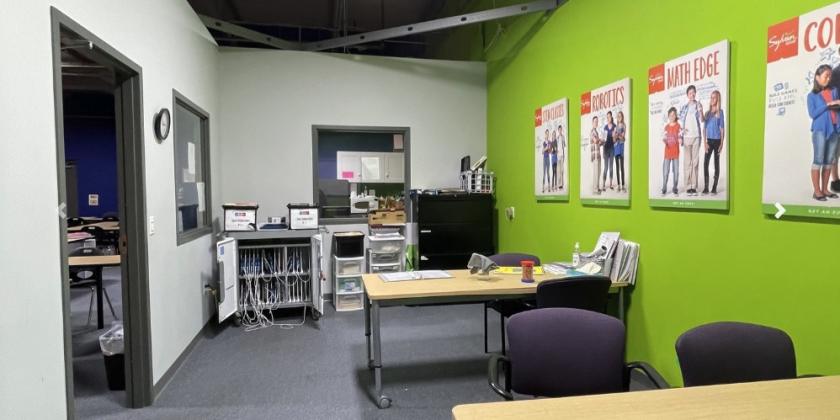
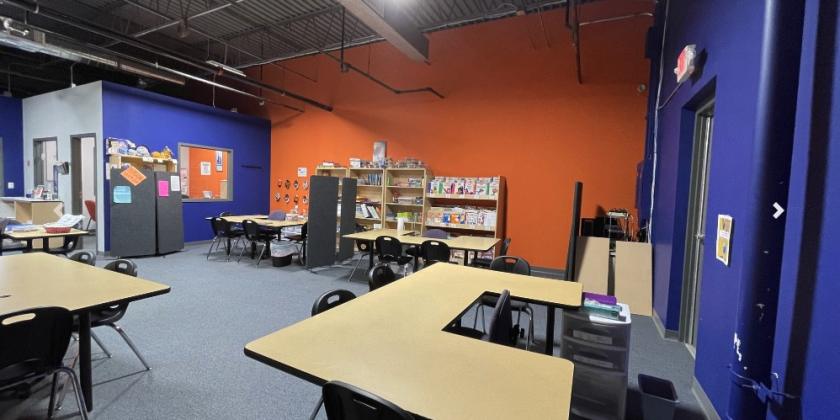
- • High Ceilings
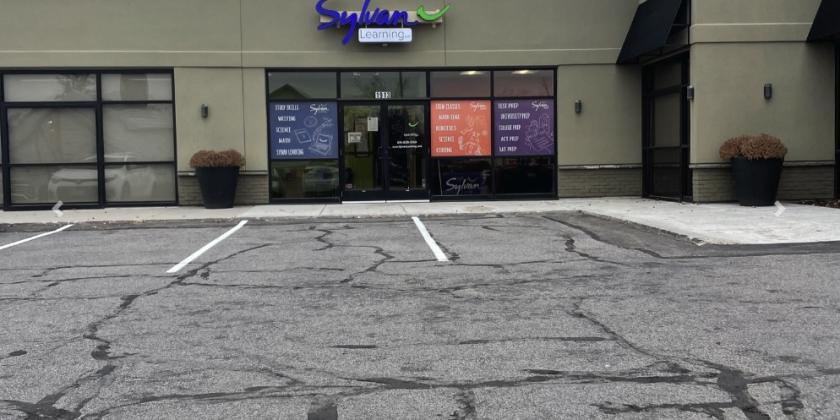
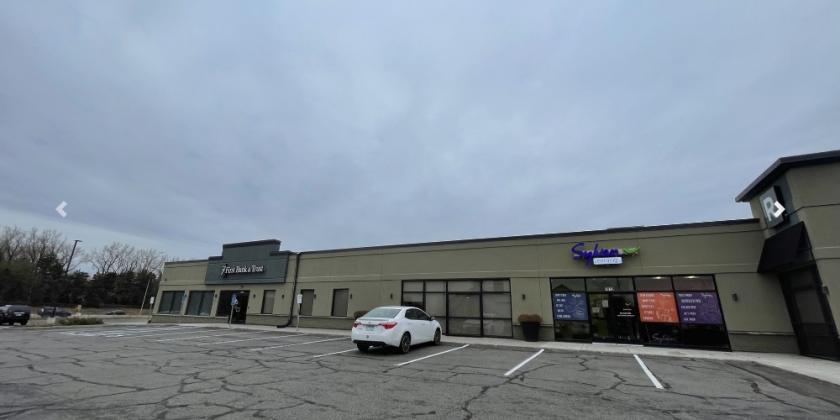
- • High Visibility
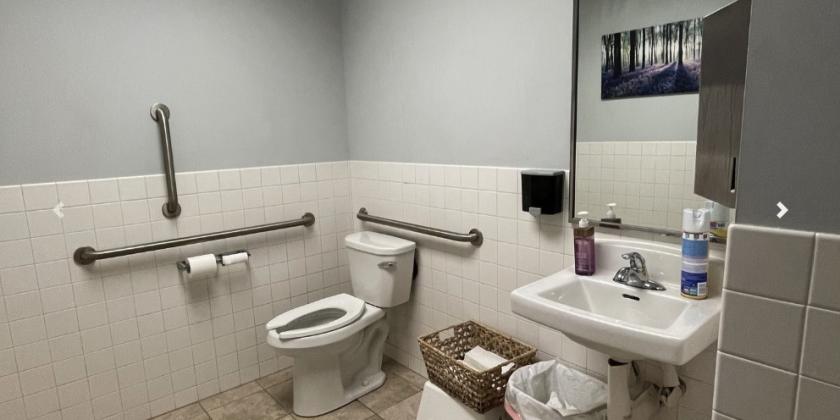
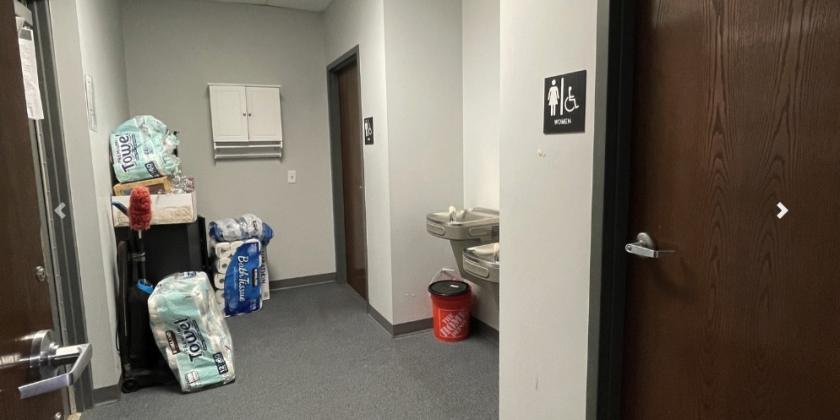
- • Two Bathrooms
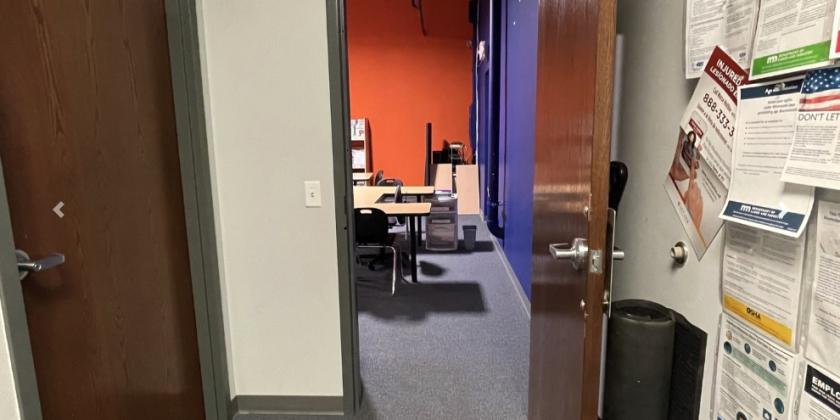
- • Clean, Open Space
- • High Traffic Retail
Additional Photos
Listing Agents

Michael Houge
O: 612-701-7454
M: 612-701-7454
michael@nailegacy.com
O: 612-701-7454
M: 612-701-7454
michael@nailegacy.com

Amelia Bjorklund
M: 952-491-3069
amelia@nailegacy.com
M: 952-491-3069
amelia@nailegacy.com
While we strive to provide the most accurate information, all listing information, and demographic data, is provided by third-parties. As such, MyEListing will not be responsible for the accuracy of the information. It is strongly recommended that you verify all information with the listing agent, and any relevant agencies, prior to making any decisions.