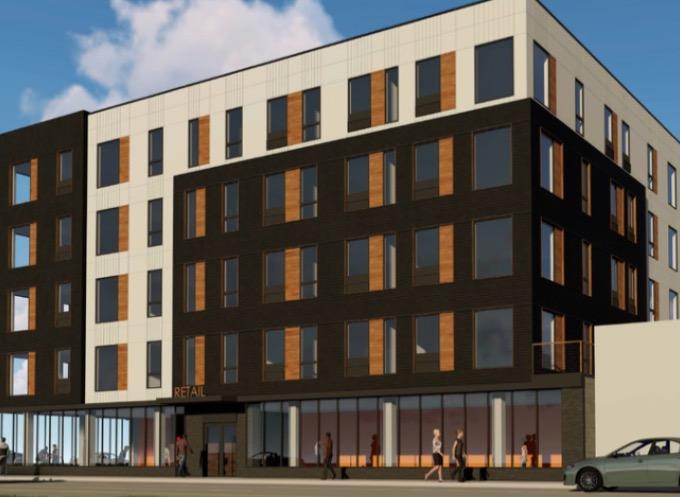
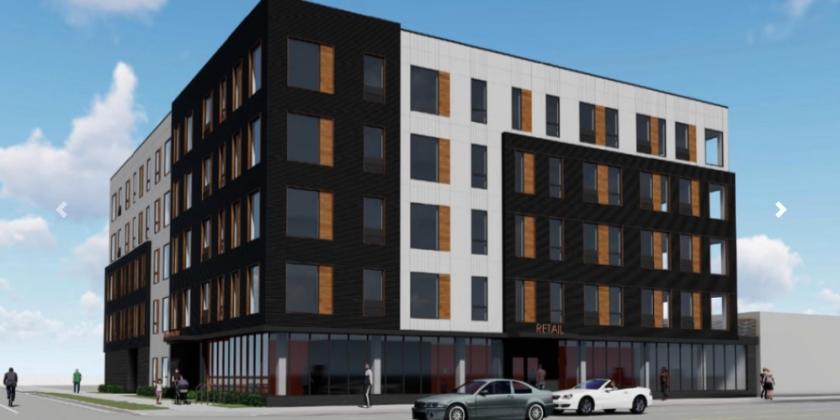
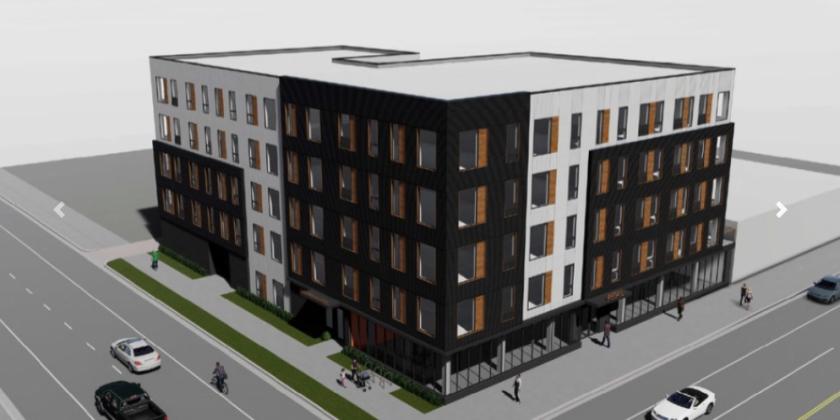
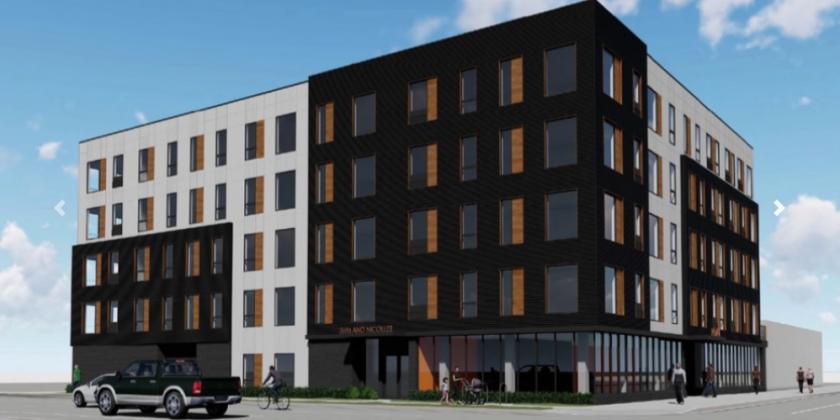
NAI Legacy is pleased to announce this listing of The Lilly Pad Apartments, a 52 -unit apartment community located in Minneapolis, Minnesota. The property is offered for sale on a free-and-clear basis in the heart of an urban market. Currently under construction with an anticipated delivery at the end of this year. The Lilly Pad sits on .29 acres and features nine studio units estimated at 360 square feet, seven alcove units estimated at 510 square feet, thirty-two one-bedroom/one-bathroom units estimated at 570 square feet, four two-bedroom/one-bathroom units estimated at 850 square feet.The property features 2,729 square feet of commercial space along with 18 indoor parking spaces and 29 bike parking spaces will also be located on the same floor and an elevator to get up to the fifth floor. Located where the Central and Bryant neighborhoods meet within the Powderhorn community of South Minneapolis. Via Interstate 35W, access to all major highways in the area is simple. There is less than a ten-minute drive to Downtown Minneapolis and about ten minutes to MSP International Airport, and twenty minutes from Downtown St. Paul. The Lilly pad lies on Nicollet Avenue, which is a major street in Minneapolis, Richfield, Bloomington, and Burnsville. It passes through a number of locally well-known neighborhoods and districts, notably Eat Street. The Iconic Mall of America is only fifteen minutes away, and there is ample shopping, dining and entertainment options nearby, and ample green space and bike paths.For tenants with children, there are numerous schools in the area, to include: Hiawatha College Prep - Kingfield (.5 miles), Lyndale Community School (.5 miles), Washburn Highschool (2.3 miles), South High School (2.3 miles), Southwest High School (4 miles). Minneapolis is the largest city of Minneapolis and is home to Twins (baseball), Timberwolves (basketball) and Vikings (football) professional sports teams. Minneapolis has hosted The Final Four (2019), Superbowl 52 (2018), The X Games (2018), and The Major League Baseball Allstar Game (2014).This offering presents the opportunity to acquire a newly developed asset in a transforming and highly desirable area of Minneapolis.