Retail Space
5401 Chicago Avenue Minneapolis, MN 55417
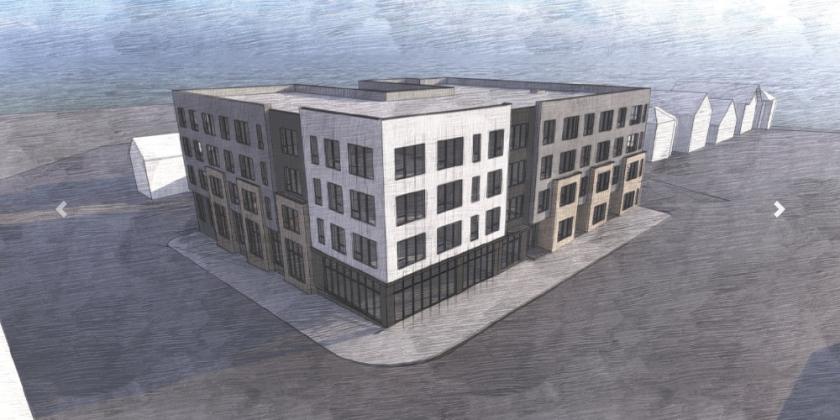
5401 Chicago Avenue Minneapolis, MN 55417

Details & Description
Property Highlights
- • Blank Canvas
- • Restaurant Space
- • High Household Income
- • Built for YOU
- • Near Nokomis
- • Up and Coming Neighborhood
Additional Photos


Listing Agents

Chris Missling
O: 612-812-1317
M: 612-812-1317
c.missling@nailegacy.com
O: 612-812-1317
M: 612-812-1317
c.missling@nailegacy.com

Amelia Bjorklund
M: 952-491-3069
amelia@nailegacy.com
M: 952-491-3069
amelia@nailegacy.com
While we strive to provide the most accurate information, all listing information, and demographic data, is provided by third-parties. As such, MyEListing will not be responsible for the accuracy of the information. It is strongly recommended that you verify all information with the listing agent, and any relevant agencies, prior to making any decisions.