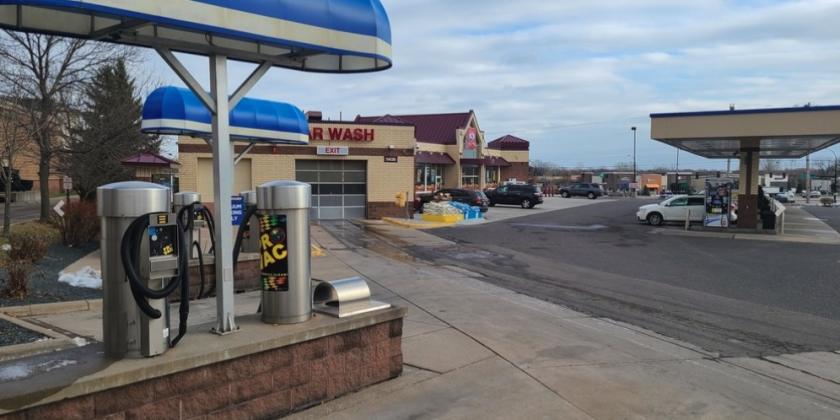
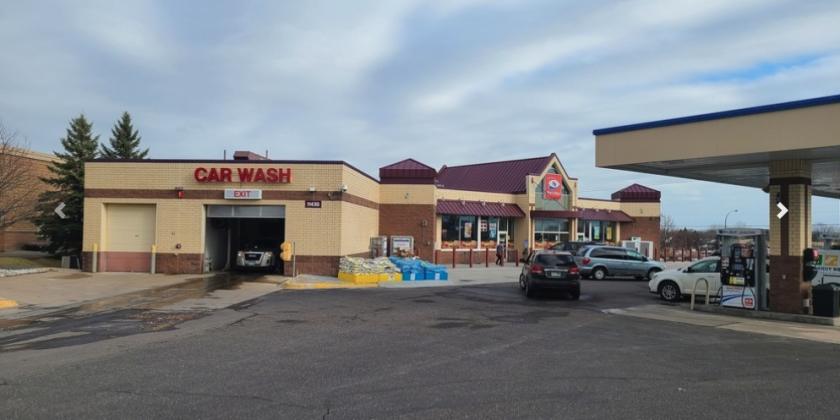
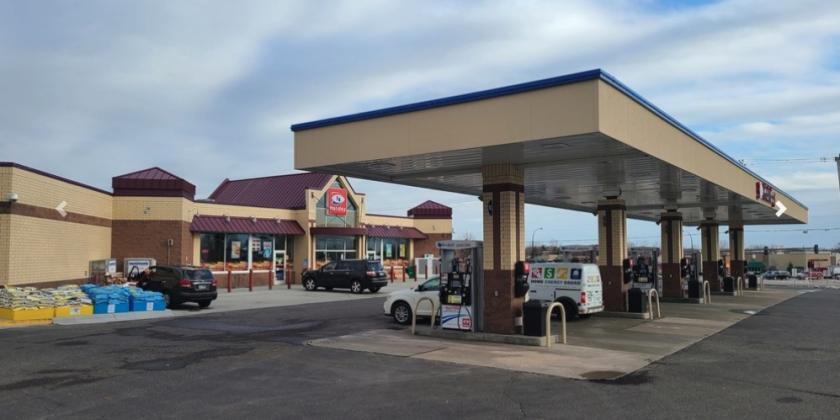
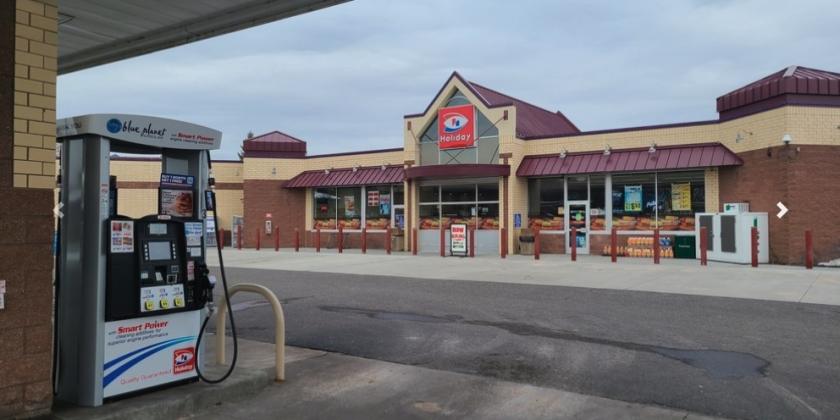
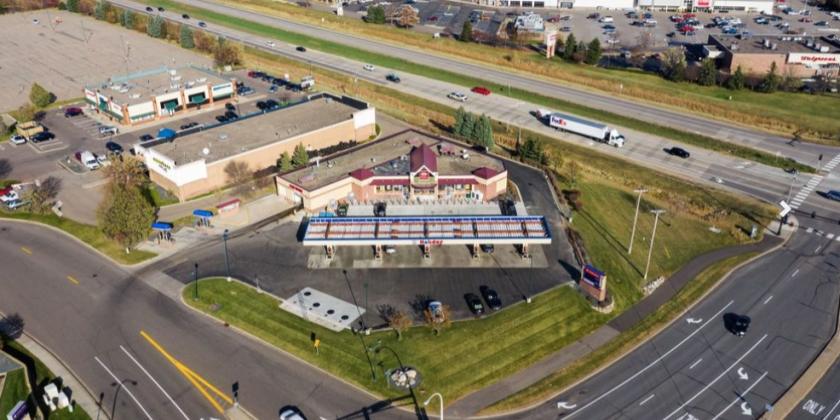
Retail Space
11430 Jefferson Court Champlin, MN 55316
11430 Jefferson Court Champlin, MN 55316

Details & Description
Property Highlights
- • 15-Year Absolute NNN Lease
- • Well maintained storefront constructed in 2002
- • Car Wash and vehicle detailing station
- • Strong Population in 3, 5 and 10 mile radius
- • Highly Visible along Highway 169
- • Excellent Ingress & Egress
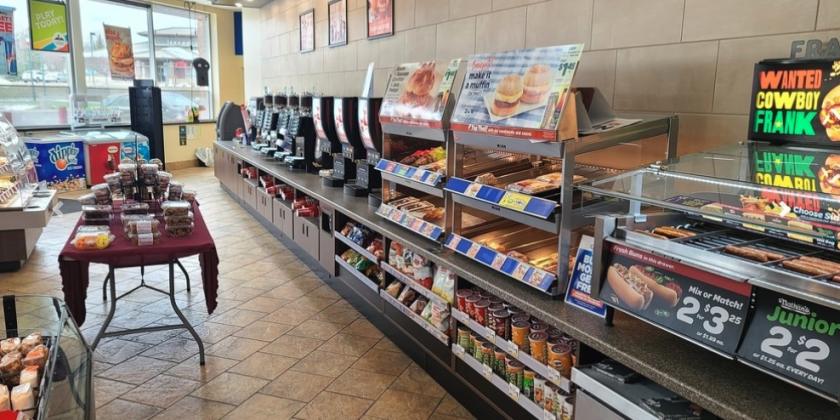
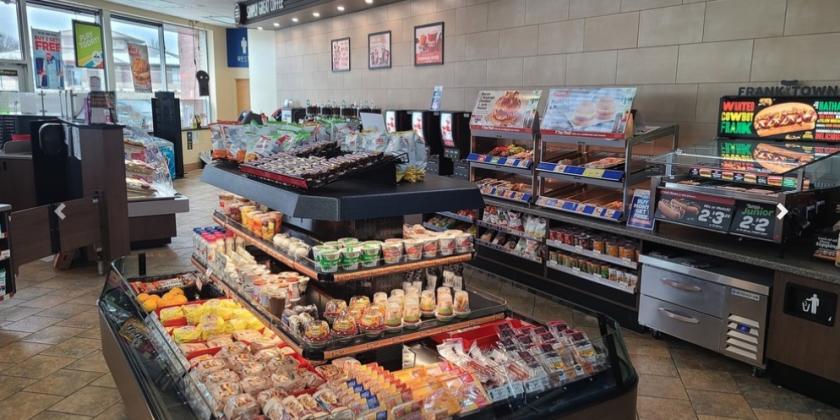
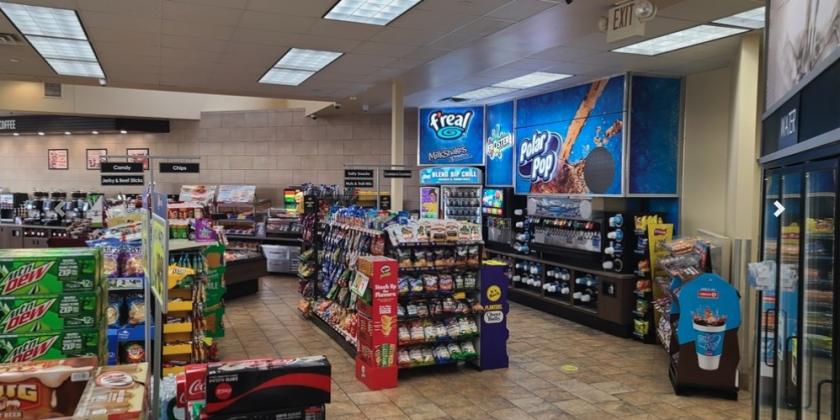
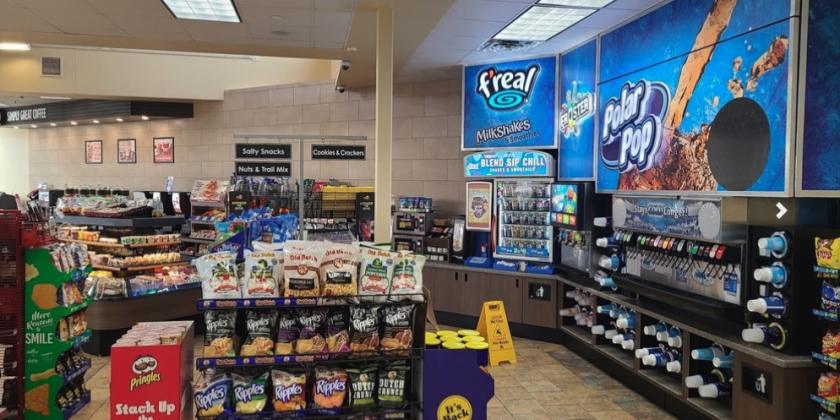
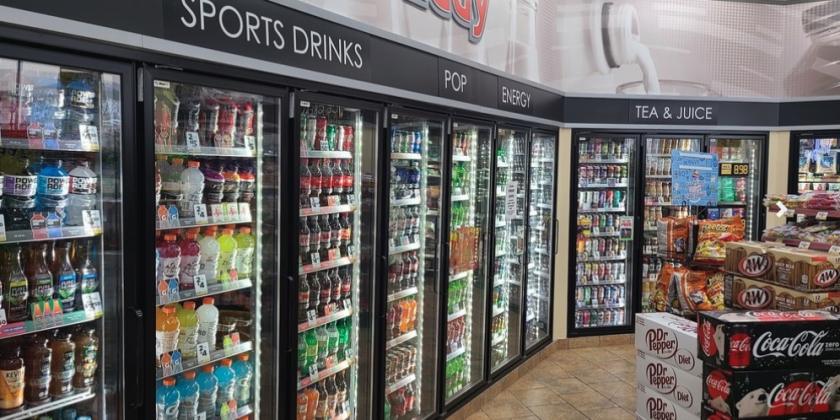
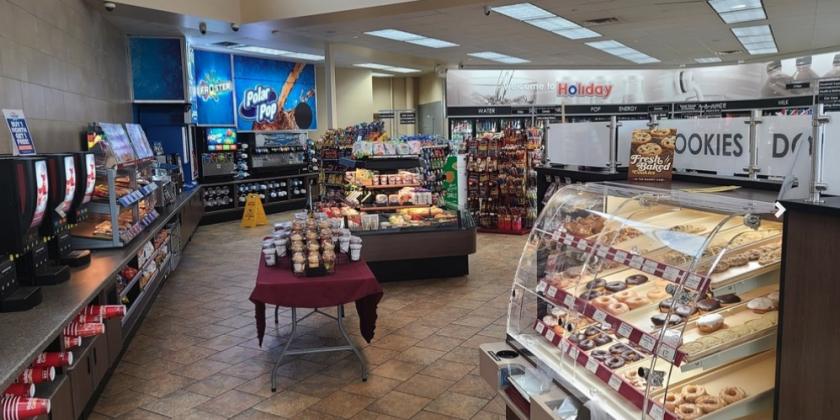
Additional Photos
Listing Agents

Jackson Phillips
M: 612-999-5265
j.phillips@nailegacy.com
M: 612-999-5265
j.phillips@nailegacy.com

Garrett Farmer
M: 612-383-2590
garrett@nailegacy.com
M: 612-383-2590
garrett@nailegacy.com
While we strive to provide the most accurate information, all listing information, and demographic data, is provided by third-parties. As such, MyEListing will not be responsible for the accuracy of the information. It is strongly recommended that you verify all information with the listing agent, and any relevant agencies, prior to making any decisions.