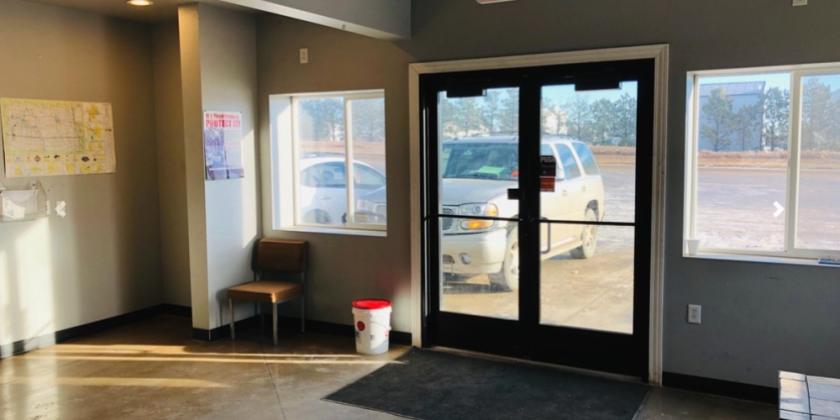
Retail Space
8153 U.S. Route 2 Stanley, ND 58784
8153 U.S. Route 2 Stanley, ND 58784

Details & Description
Property Highlights
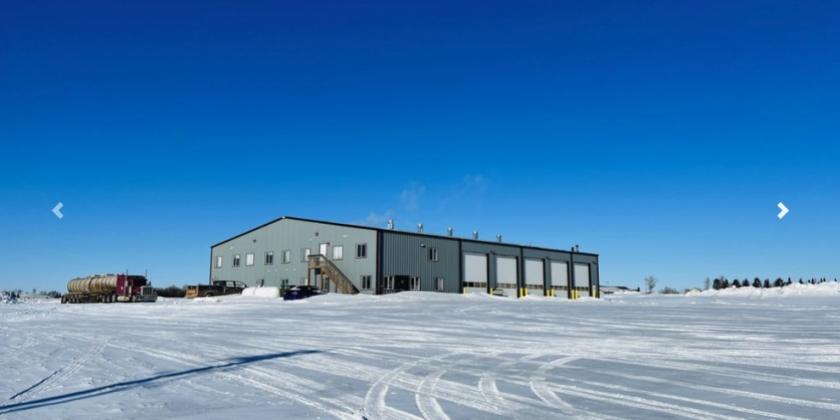
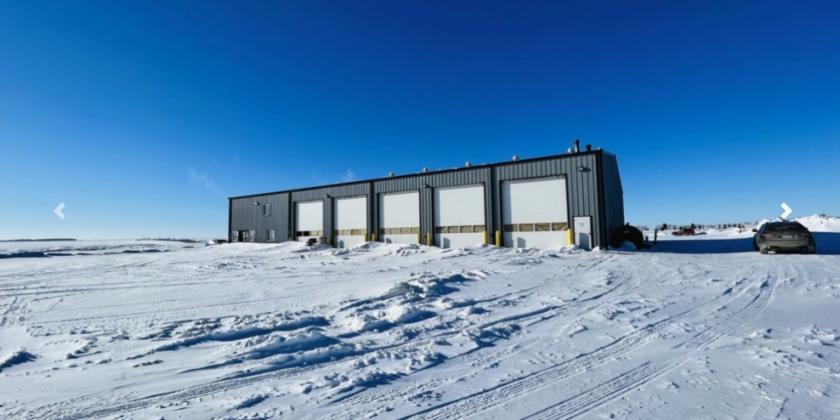
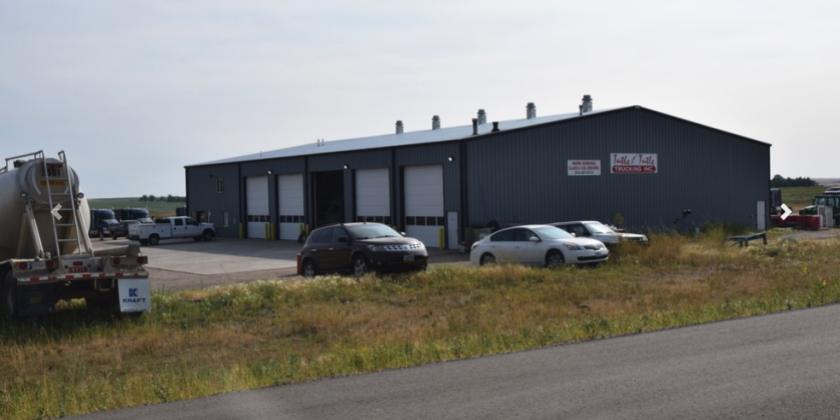
- • Five drive-through bays
- • Full-length Mechanic's Pit
- • Waste oil Heater
- • Up to 80 Acres are Available
- • 18' H X 14'W Overhead Doors
- • Oil and Water Separators
Additional Photos


Listing Agents

Michael Houge
O: 612-701-7454
M: 612-701-7454
michael@nailegacy.com
O: 612-701-7454
M: 612-701-7454
michael@nailegacy.com
While we strive to provide the most accurate information, all listing information, and demographic data, is provided by third-parties. As such, MyEListing will not be responsible for the accuracy of the information. It is strongly recommended that you verify all information with the listing agent, and any relevant agencies, prior to making any decisions.