Commercial Land
4100 Vista Ln Crandall, TX 75114
4100 Vista Ln Crandall, TX 75114
Details & Description
Property Highlights
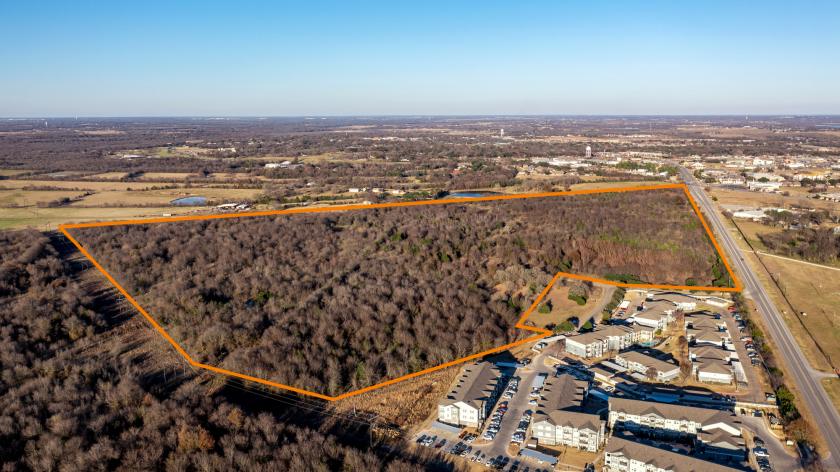
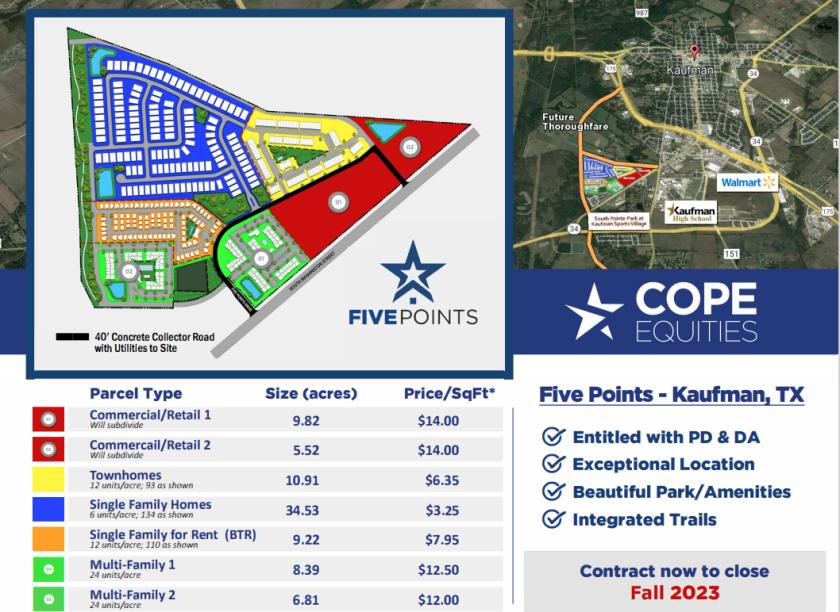
• Kaufman High School and O.P. Norman Junior High School are Located 1/2 Mile East of the Development Across S. Washingto
• 2,400 ft. of Frontage on S. Washington Street (Highway 34) and 1,550 ft. of Frontage on Lakeside Drive
Listing Agents

David Dunn
O: 817-640-9964
M: 817-829-2828
david.dunn@svn.com
O: 817-640-9964
M: 817-829-2828
david.dunn@svn.com
While we strive to provide the most accurate information, all listing information, and demographic data, is provided by third-parties. As such, MyEListing will not be responsible for the accuracy of the information. It is strongly recommended that you verify all information with the listing agent, and any relevant agencies, prior to making any decisions.