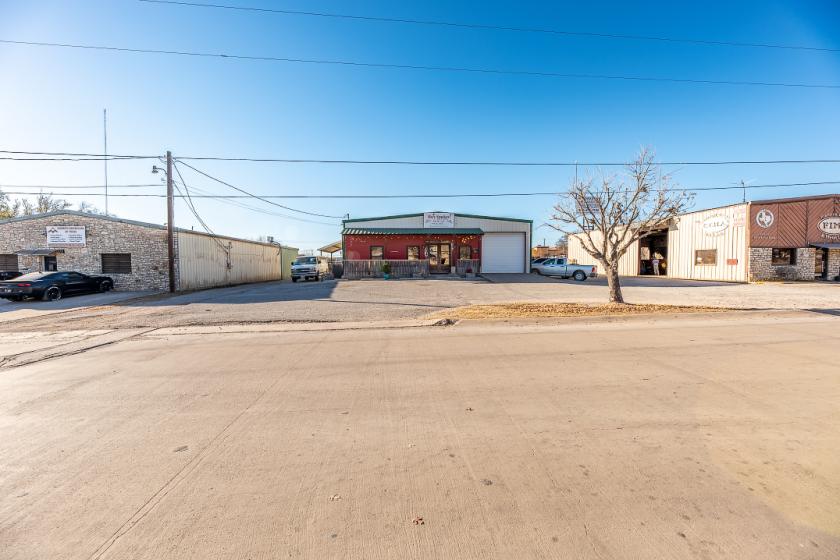
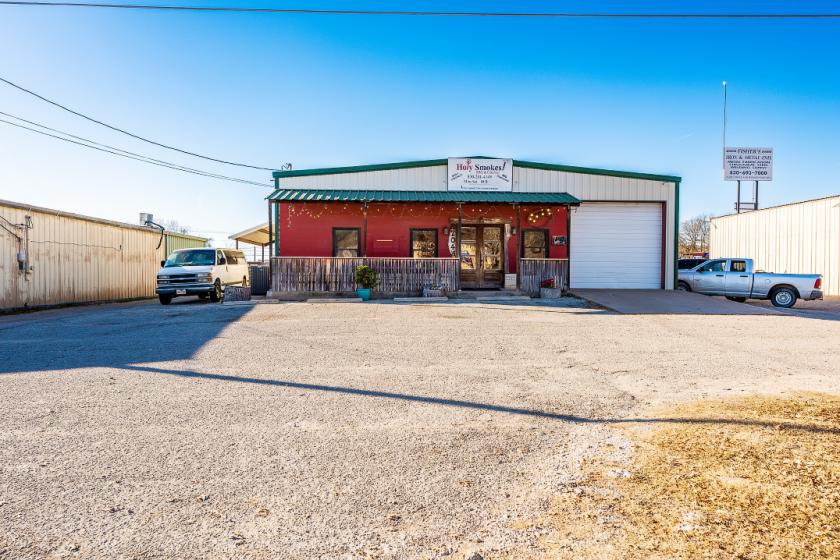
Industrial Properties
2704 A Commerce Street Marble Falls, TX 78654
2704 A Commerce Street Marble Falls, TX 78654

Details & Description
Property Highlights
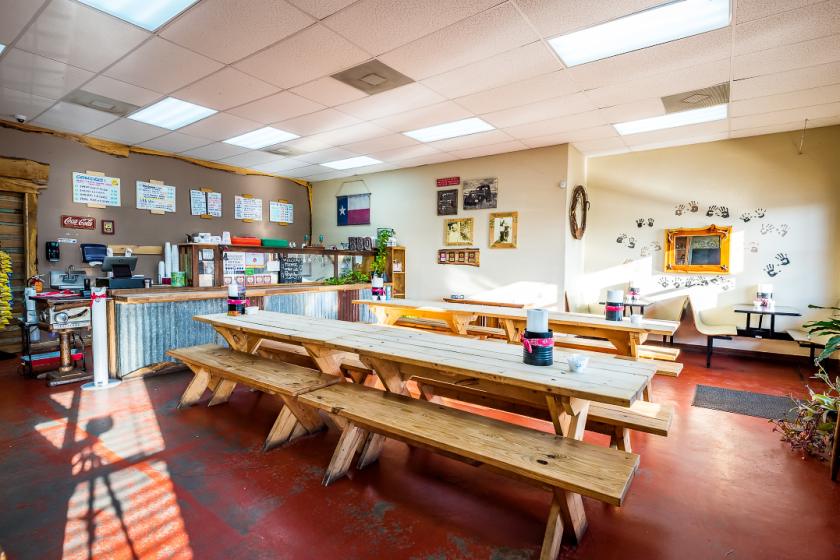
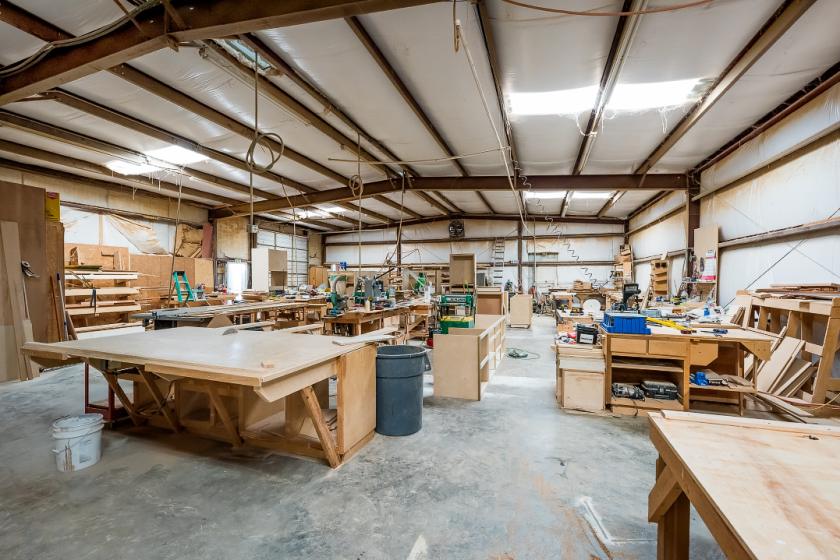
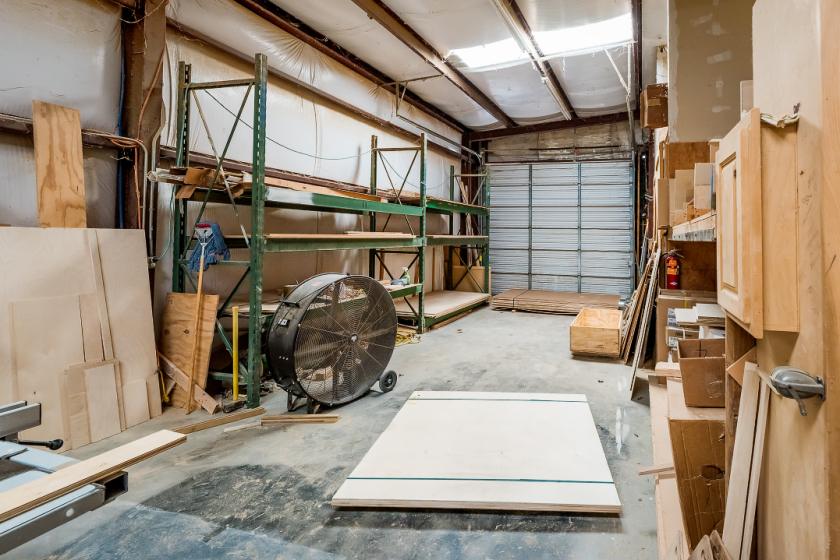
- • Fully-leased Restaurant & Cabinet Shop
- • Zoned GC (General Commercial)
- • Street Access
- • Overhead Doors
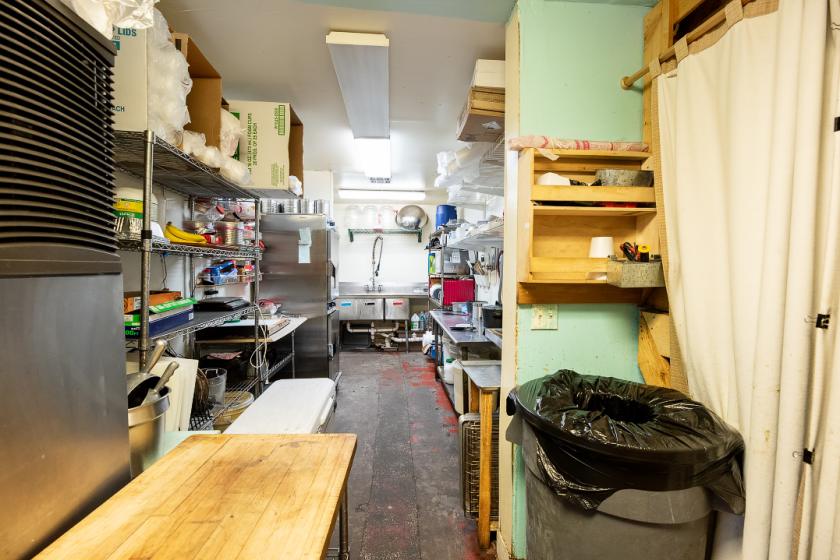
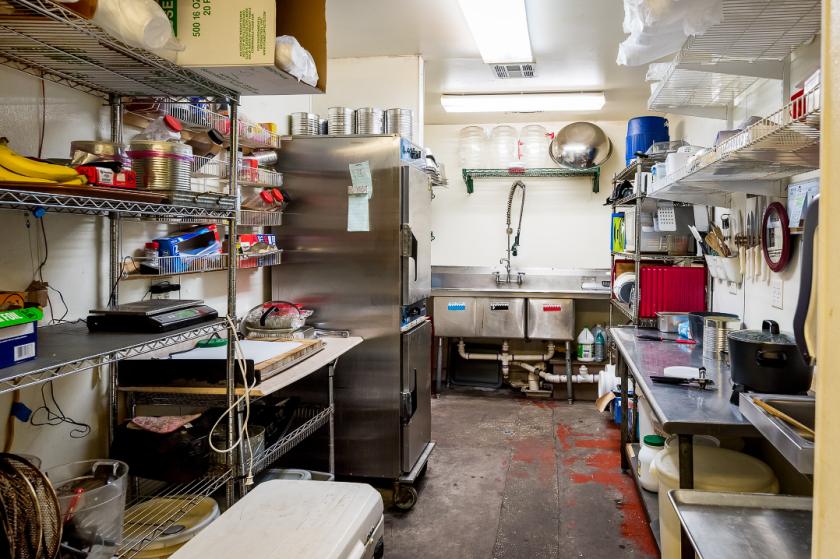
Additional Photos


Listing Agents

Zach Roesinger
O: 512-949-1418
M: 512-949-1418
zroesinger@resolutre.com
O: 512-949-1418
M: 512-949-1418
zroesinger@resolutre.com
While we strive to provide the most accurate information, all listing information, and demographic data, is provided by third-parties. As such, MyEListing will not be responsible for the accuracy of the information. It is strongly recommended that you verify all information with the listing agent, and any relevant agencies, prior to making any decisions.