Retail Space
10200 South Vincennes Avenue Chicago, IL 60643
10200 South Vincennes Avenue Chicago, IL 60643
Details & Description
Property Highlights
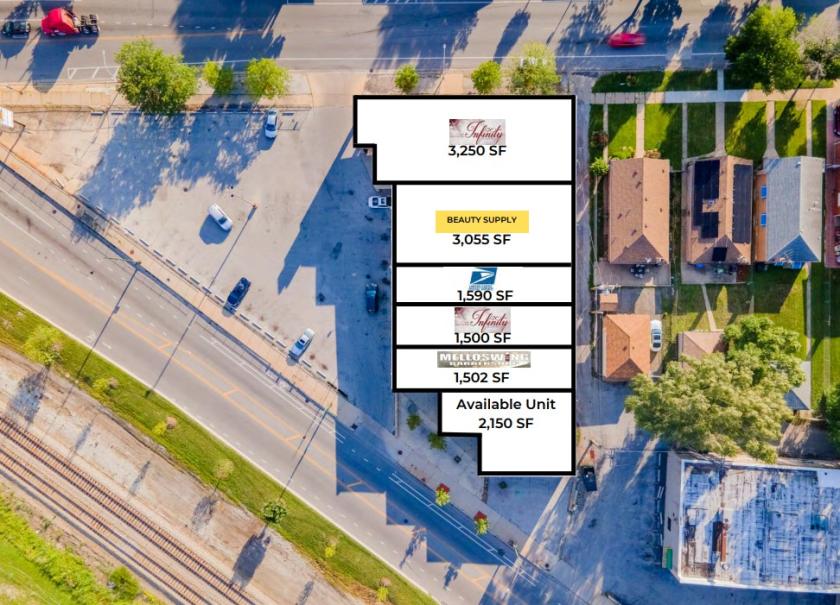
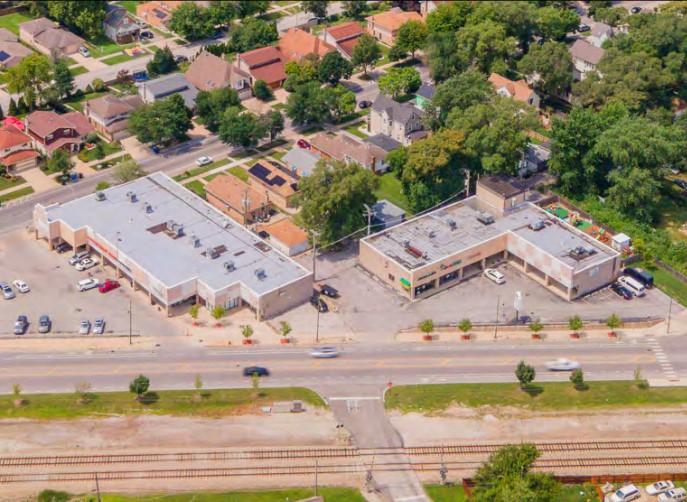
- • 86% Leased Retail Strip Center
- • Excellent Access and Visibility
- • United States Post Office is an Anchor Tenant
Listing Agents

Tony Hardy
O: 773-575-6082
tonyhardy@kw.com
O: 773-575-6082
tonyhardy@kw.com

Travis Montgomery
O: 773-946-8816
travis.m@kwcommercial.com
O: 773-946-8816
travis.m@kwcommercial.com

Ariana Abercrumbie
O: 312-216-2422
M: 312-805-3756
ariana@kwcommercial.com
O: 312-216-2422
M: 312-805-3756
ariana@kwcommercial.com
While we strive to provide the most accurate information, all listing information, and demographic data, is provided by third-parties. As such, MyEListing will not be responsible for the accuracy of the information. It is strongly recommended that you verify all information with the listing agent, and any relevant agencies, prior to making any decisions.