Prime Location For Warehouse Distribution Now Available For Lease!
5,500 SF (5,000 SF open warehouse / 500 SF office)
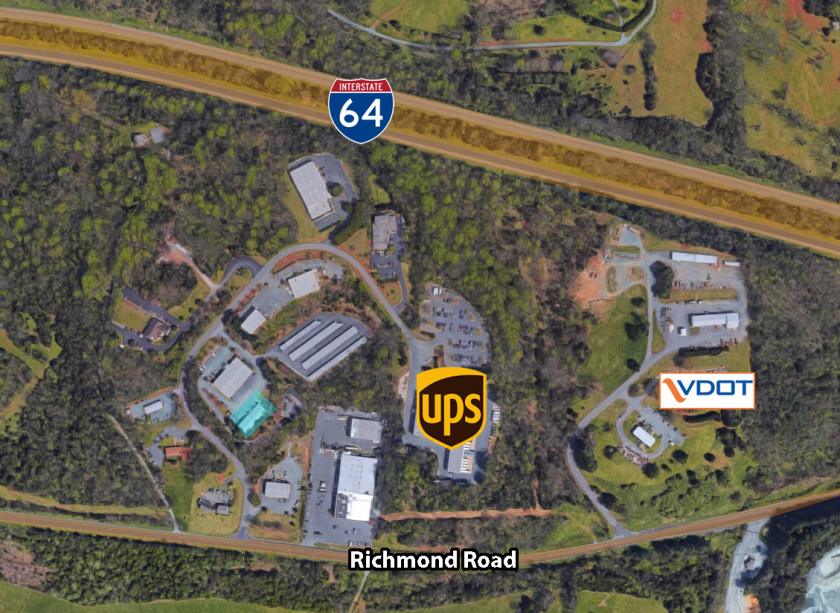
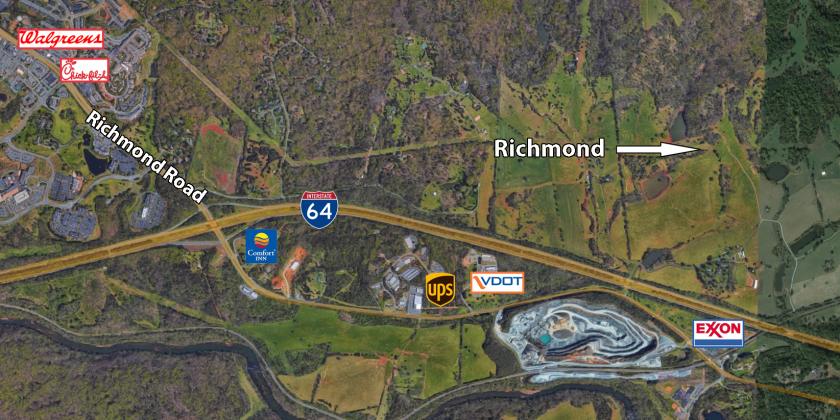
Less than a mile from I-64 via Richmond Road
12 dock doors (6 ft W x 8 ft H) / city truck height
Zoned Light Industry
Clear span, no columns; 15-Foot center height
Lease Rate: $16.36/sf/yr NNN
Tenant pays electricity, gas, and telephone/data
No part of this information may be copied, reproduced, repurposed, or screen-captured for any commercial purpose without prior written authorization from MyEListing.
While we strive to provide the most accurate information, all listing information, and demographic data, is provided by third-parties. As such, MyEListing will not be responsible for the accuracy of the information. It is strongly recommended that you verify all information with the listing agent, and any relevant agencies, prior to making any decisions.
What is the asking price for 2355 Hunters Way in Charlottesville?
The asking price for 2355 Hunters Way is $
What is the building size of this commercial Flex/Office Whs property?
The size of this lease property at '.2355 Hunters Way.' is 5500 square feet
What is the population within 1 mile of 2355 Hunters Way in Charlottesville?
The population within 1 mile of 2355 Hunters Way Charlottesville, VA 22911 is 752 people.
Who do I contact for questions about 2355 Hunters Way?
You should contact the listing agent,
Robert Duckett, for any details regarding this commercial listing.