Retail Space
2515 - 2525 N Scottsdale Rd Scottsdale, AZ 85257
2515 - 2525 N Scottsdale Rd Scottsdale, AZ 85257
Details & Description
Property Highlights
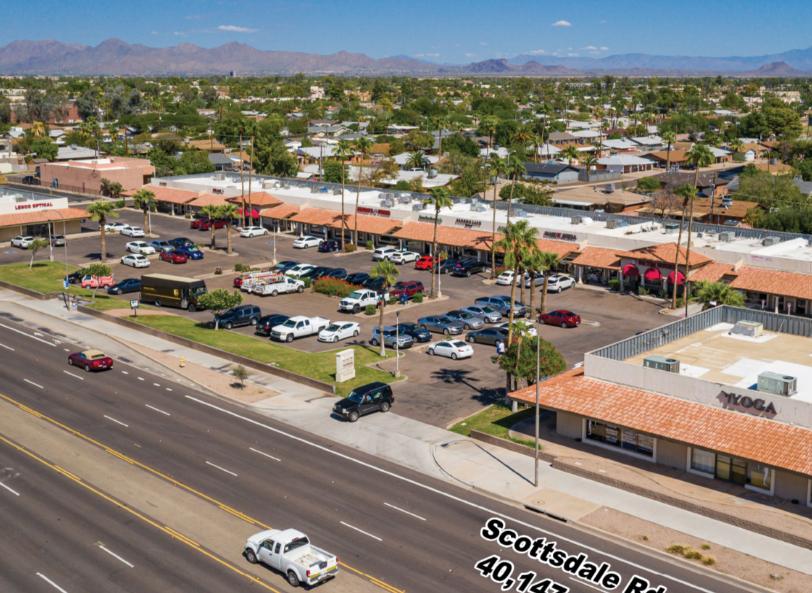
• Ownership currently refreshing center with fresh paint to the exterior, parking lots and two new monument signs
• Great Co-tenancy with Barros Pizza, Hot Yoga University, Goodwill and Atlas Bistro
Additional Photos


Listing Agents

Kalen Rickard
O: 602-931-4492
krickard@w-retail.com
O: 602-931-4492
krickard@w-retail.com

Jason Fessinger
O: 602-368-1090
jfessinger@w-retail.com
O: 602-368-1090
jfessinger@w-retail.com

Julie Green
Western Retail Advisors
O: 602-710-1786
jgreen@w-retail.com
Western Retail Advisors
O: 602-710-1786
jgreen@w-retail.com
While we strive to provide the most accurate information, all listing information, and demographic data, is provided by third-parties. As such, MyEListing will not be responsible for the accuracy of the information. It is strongly recommended that you verify all information with the listing agent, and any relevant agencies, prior to making any decisions.


