Retail Space
289 Saint Aubin Street Detroit, MI 48207
289 Saint Aubin Street Detroit, MI 48207
Details & Description
Property Highlights
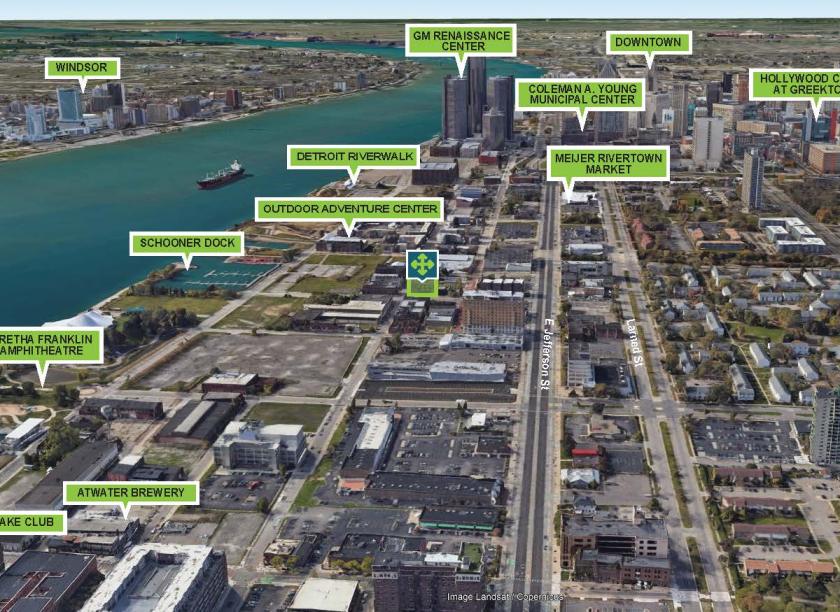
- • Redevelopment opportunity
- • Parking Lot Included
- • Near Rivertown Meijer Grocery Development
- • 1.3 miles from Downtown Detroit
- • Near GM RenCen
- • Highway Access Nearby
Additional Photos


Listing Agents

Brianna Johnston
O: 248-663-0507
M: 419-605-8579
brianna@pacommercial.com
O: 248-663-0507
M: 419-605-8579
brianna@pacommercial.com

Anthony Pellegrino
O: 248-358-5341
M: 313-878-7735
anthony@pacommercial.com
O: 248-358-5341
M: 313-878-7735
anthony@pacommercial.com
While we strive to provide the most accurate information, all listing information, and demographic data, is provided by third-parties. As such, MyEListing will not be responsible for the accuracy of the information. It is strongly recommended that you verify all information with the listing agent, and any relevant agencies, prior to making any decisions.


