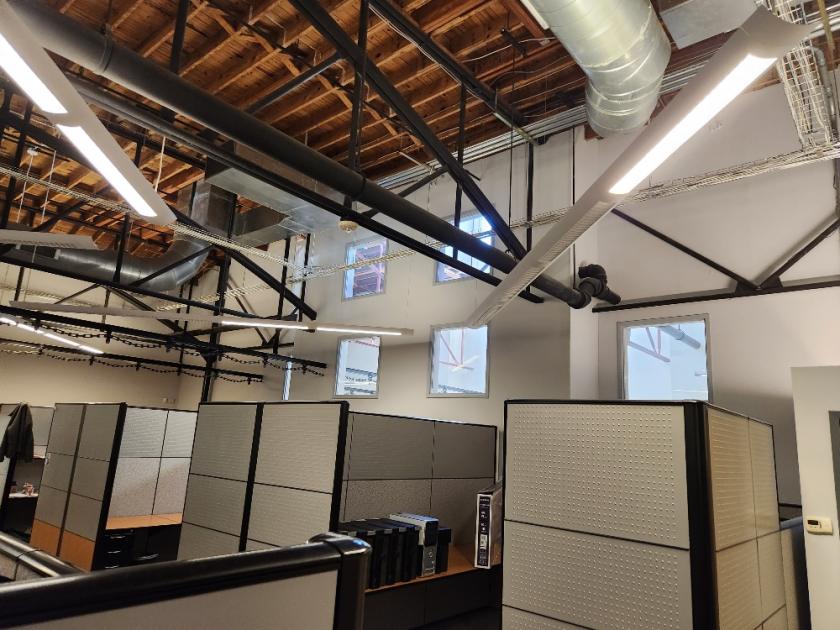
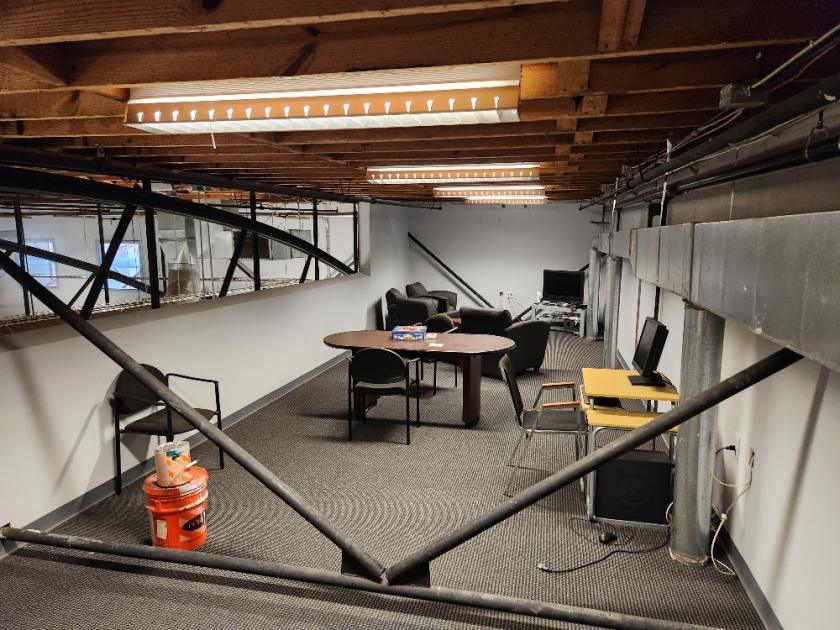
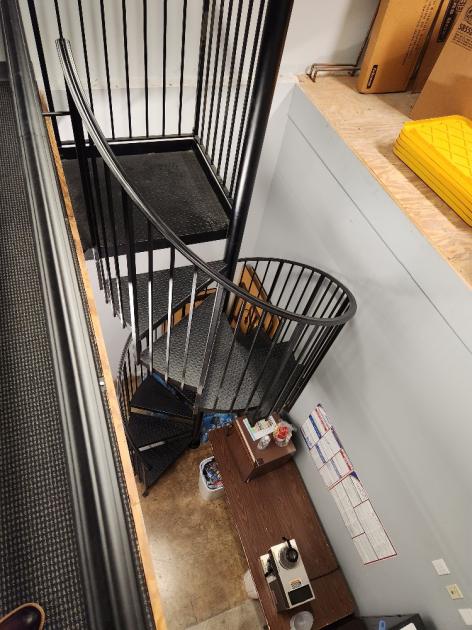
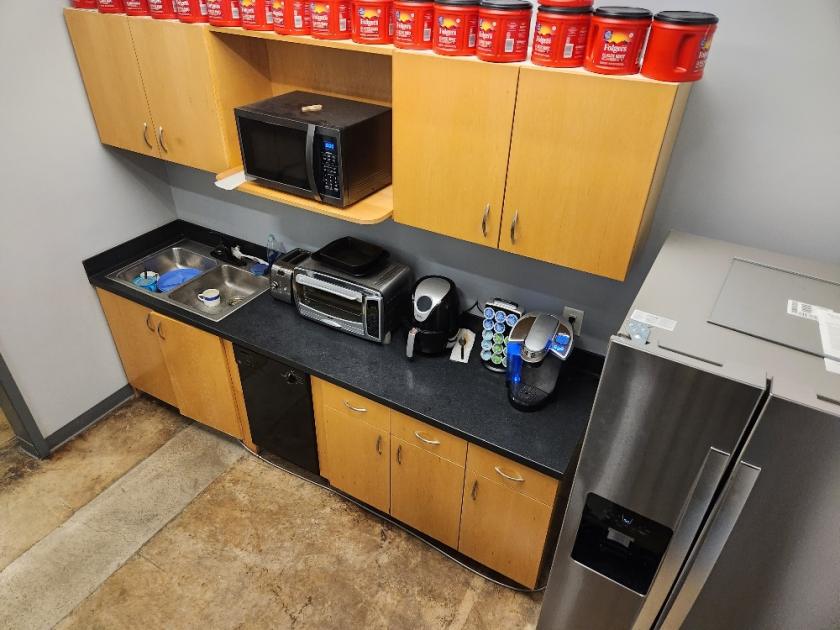
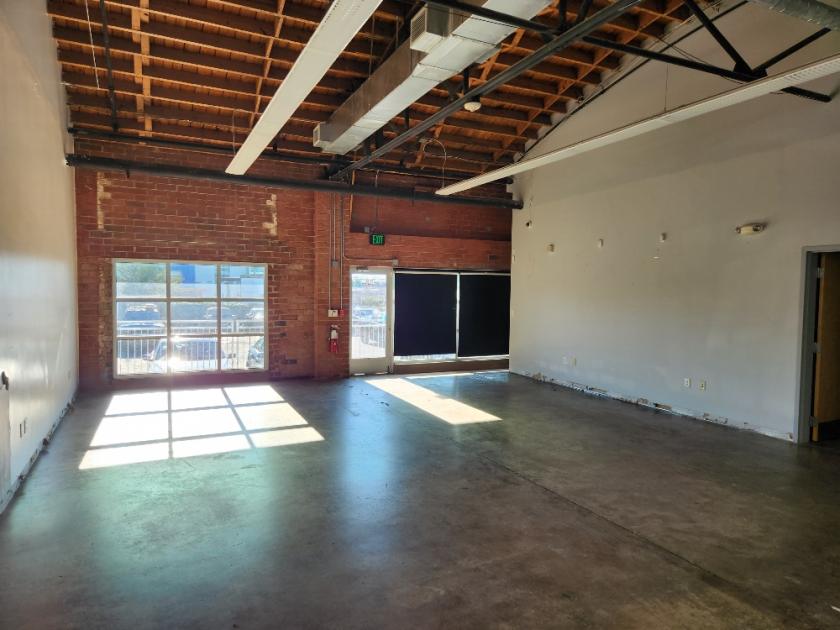
Office Space
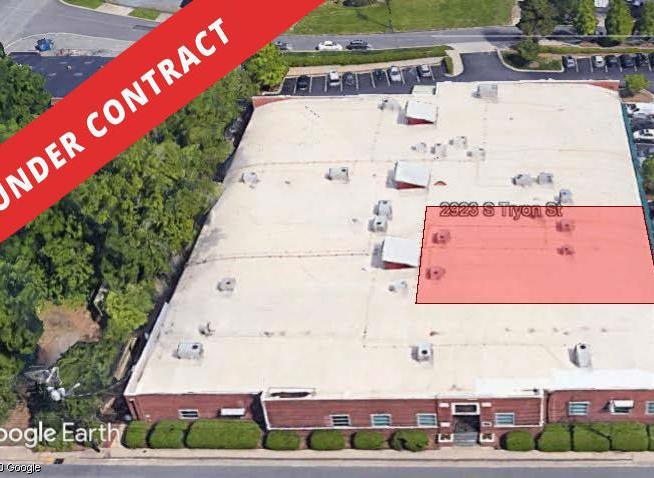
2923 South Tryon Street 260 and 280 Charlotte, NC 28203
2923 South Tryon Street 260 and 280 Charlotte, NC 28203
Details & Description
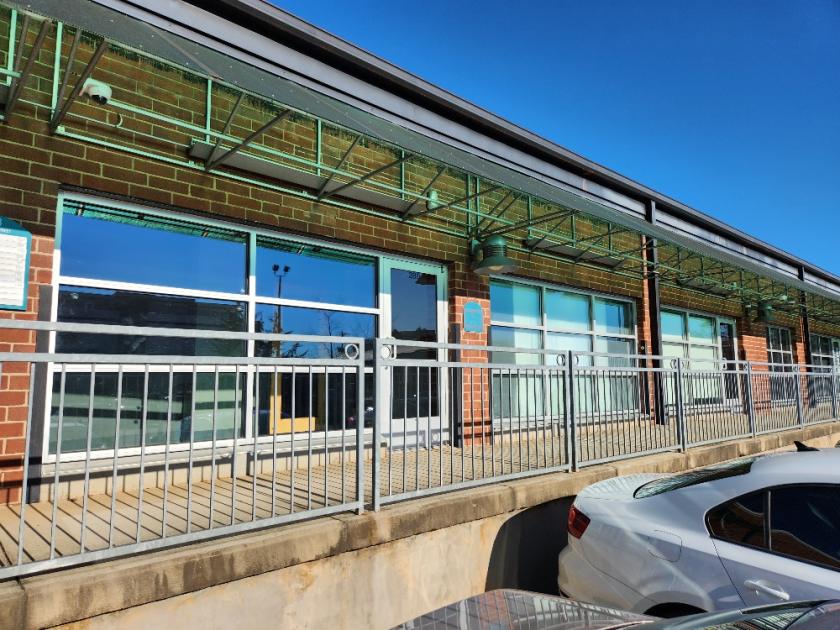
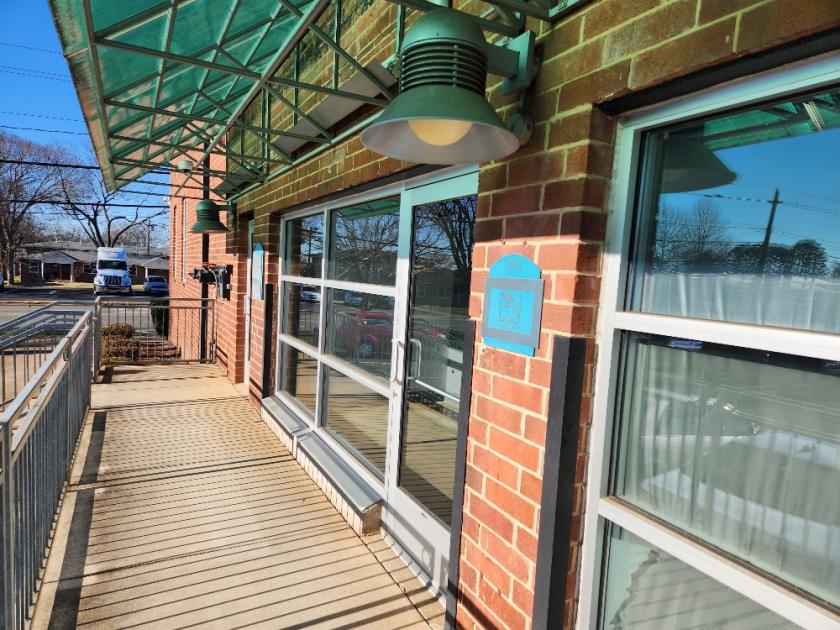
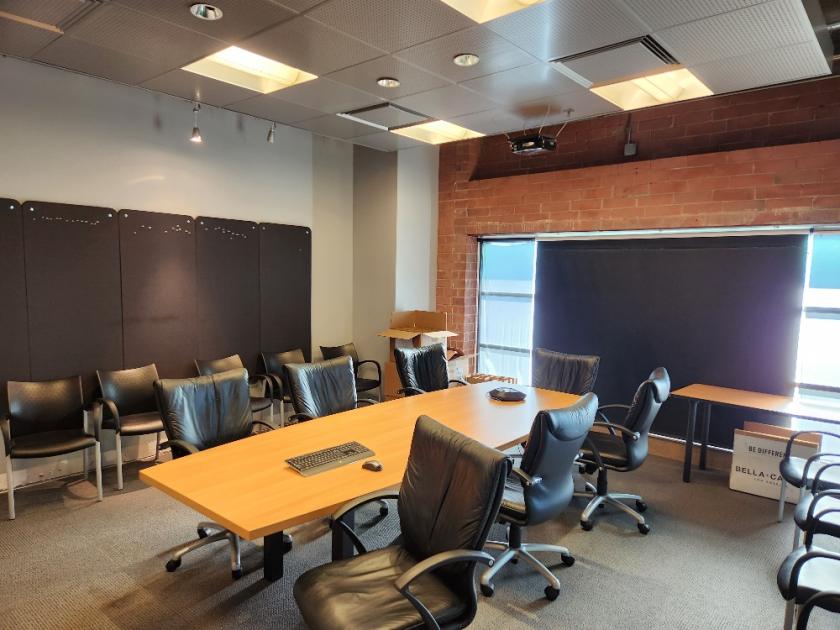
Additional Photos

Listing Agents

Ian Bertolina
O: 704-333-9881
ib@bertolinacresi.com
O: 704-333-9881
ib@bertolinacresi.com
While we strive to provide the most accurate information, all listing information, and demographic data, is provided by third-parties. As such, MyEListing will not be responsible for the accuracy of the information. It is strongly recommended that you verify all information with the listing agent, and any relevant agencies, prior to making any decisions.