Concrete construction, security concrete perimeter wall, detail bay, clubhouse, RV dump, and more!
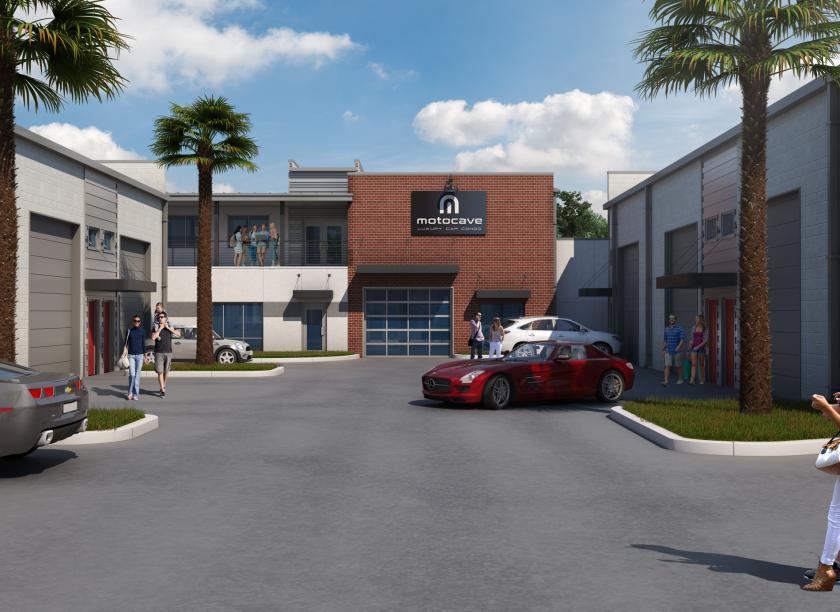
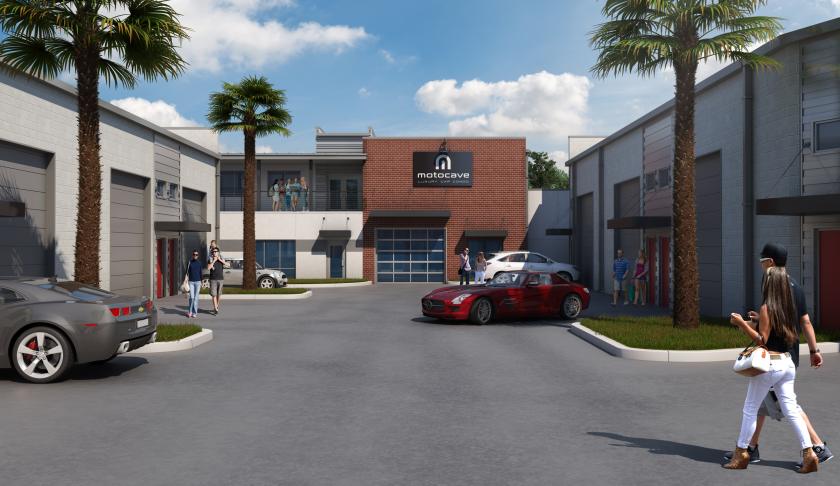
Imagine a space that is beyond vehicle storage. Imagine Motocave.
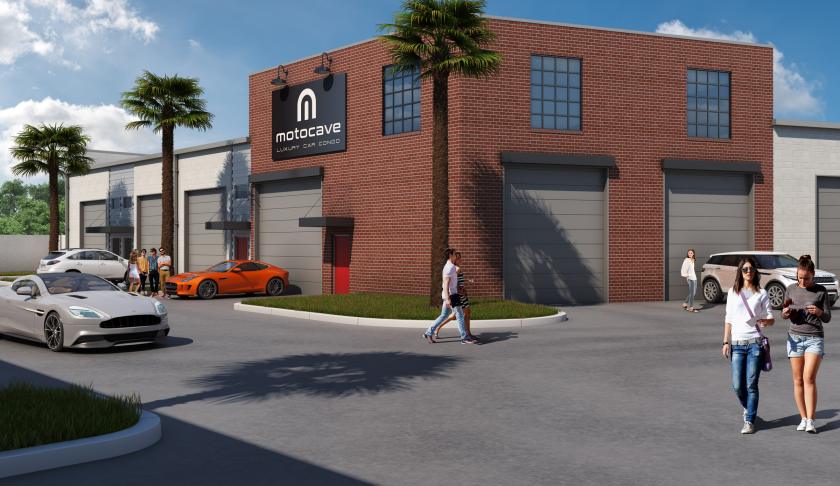
Secure, Luxurious & Convenient, Motocave is a unique destination for your luxury storage needs. Our 43 units are a blank canvas, limited only by your imagination.
Our units will be constructed of concrete block with a pre-cast hollow core concrete roof deck. These are built to last, and you can rest assured knowing your valuables are locked away tight.
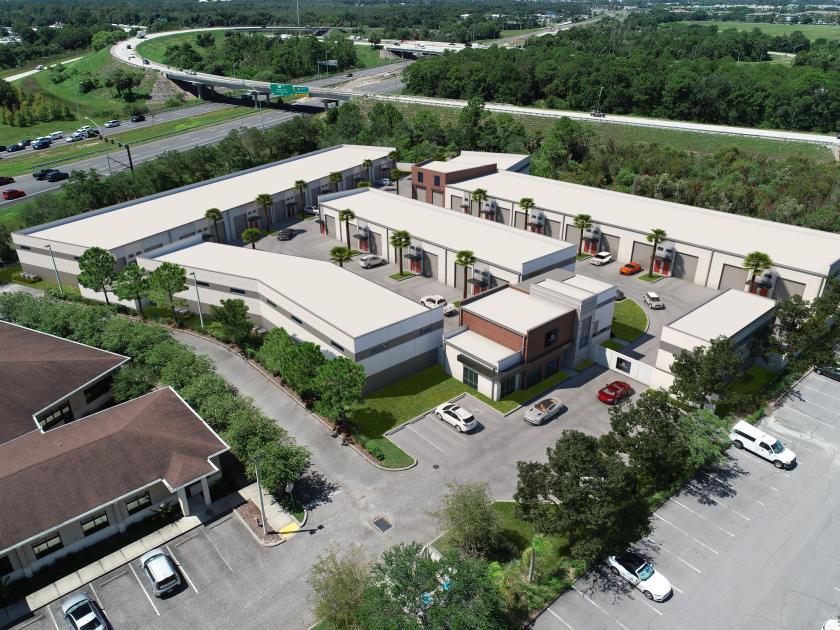
We have 43 units to choose from in a variety of sizes from 918 sf up to 1,591 sf
Ideally located at the NE corner of the intersection of Gandy and I-275, our site makes it easy to access your space from wherever, including Downtown St. Pete, Clearwater, the beaches, and South Tampa.
Come be a part of a limited club, complete with a two story clubhouse with green space and a second story covered balcony for all of your company and personal event needs.
**Not all available units are reflected in the available section**
No part of this information may be copied, reproduced, repurposed, or screen-captured for any commercial purpose without prior written authorization from MyEListing.
While we strive to provide the most accurate information, all listing information, and demographic data, is provided by third-parties. As such, MyEListing will not be responsible for the accuracy of the information. It is strongly recommended that you verify all information with the listing agent, and any relevant agencies, prior to making any decisions.
What is the building size of this Flex/Office Whs property in St Petersburg, FL?
The size of the building/unit at 2051 Gandy Blvd North in St Petersburg is 51,000 square feet
What is the population within 1 mile of 2051 Gandy Blvd North in St Petersburg?
The population within 1 mile of 2051 Gandy Blvd North St Petersburg, FL 33702 is 7,855 people.
Who do I contact for questions about 2051 Gandy Blvd North?
You should contact the listing agent,
Austin Karrick, for any details regarding this commercial listing.