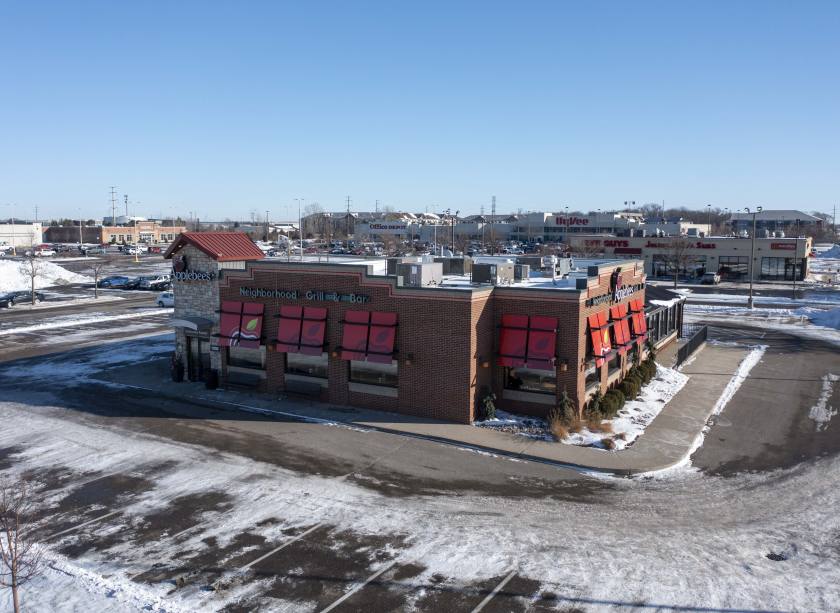
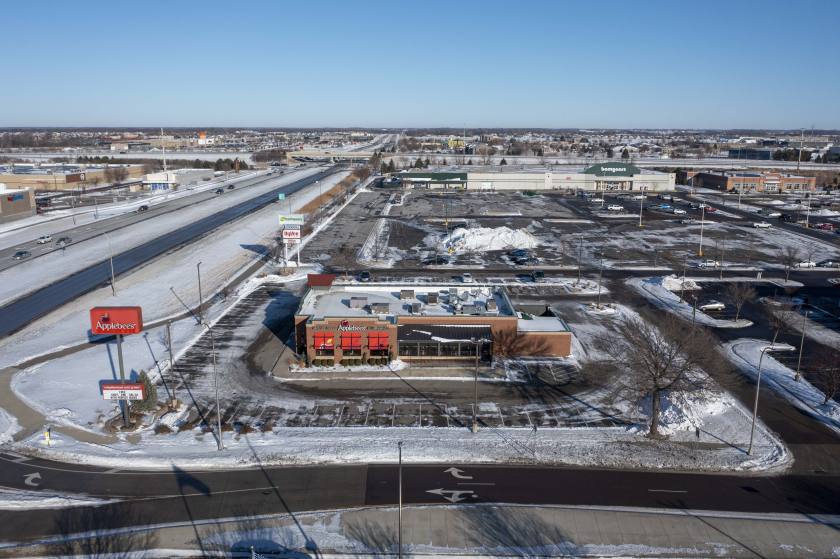
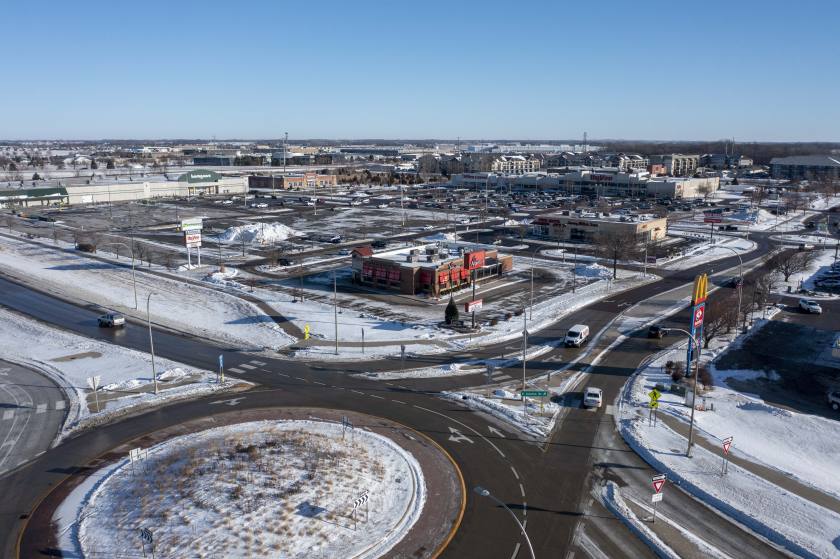
1-Mile | 3-Miles | 5-Miles | ||
---|---|---|---|---|
Total Population | 2,765 | 28,809 | 57,047 | |
Population Median Age | 40 | 35 | 35 | |
Population by Age | 0-9 Yrs | 249 (9%) | 2851 (9%) | 6395 (11%) |
10-19 Yrs | 437 (15%) | 3613 (12%) | 8164 (14%) | |
20-29 Yrs | 418 (15%) | 9134 (31%) | 14976 (26%) | |
30-39 Yrs | 312 (11%) | 3395 (11%) | 7156 (12%) | |
40-49 Yrs | 340 (12%) | 2534 (8%) | 5075 (8%) | |
50-59 Yrs | 239 (8%) | 2218 (7%) | 4849 (8%) | |
60-69 Yrs | 379 (13%) | 2676 (9%) | 5551 (9%) | |
70+ Yrs | 390 (14%) | 2388 (8%) | 4881 (8%) | |
Median HH Income | $56,045 | $50,015 | $57,250 | |
Total Household Income | < 24K | 212 (18%) | 2982 (24%) | 4672 (20%) |
25-49K | 241 (20%) | 3014 (25%) | 5398 (23%) | |
50-74K | 299 (25%) | 2090 (17%) | 3931 (17%) | |
75-99K | 125 (10%) | 1594 (13%) | 3219 (14%) | |
100-199K | 232 (19%) | 2027 (16%) | 4483 (19%) | |
200K+ | 59 (5%) | 288 (2%) | 840 (3%) | |
Highest Education Level | No Diploma | 176 | 1039 | 1721 |
Diploma or GED | 543 | 3784 | 7723 | |
Some College | 276 | 3401 | 6397 | |
Assoc. Degree | 192 | 1917 | 3814 | |
Bachelors Degree | 402 | 3785 | 8346 | |
Higher Degree | 207 | 1748 | 4215 | |
Total Housing Units | 1,253 | 12,944 | 24,438 | |
--Owner-Occupied | 657 | 5,641 | 12,569 | |
--Renter-Occupied | 511 | 6,353 | 9,975 | |
Owner-Occupied Values | < 100K | 79 | 771 | 1519 |
100-199K | 179 | 2537 | 5089 | |
200-299K | 252 | 1605 | 3938 | |
300-399K | 111 | 435 | 1072 | |
400-499K | 14 | 124 | 399 | |
500K+ | 23 | 169 | 552 | |
Total Working Age Population | 2,205 | 24,300 | 47,312 | |
In Work Force | 1,430 | 17,545 | 33,939 | |
Not In Work Force | 775 | 6,755 | 13,373 | |
Workforce Employed | 1,320 | 16,704 | 32,453 | |
Workforce Unemployed | 109 | 808 | 1,423 | |
Civlian Workforce | 1,429 | 17,512 | 33,876 | |
Military Workforce | 1 | 33 | 63 | |
Total Households | 1,168 | 11,994 | 22,544 | |
Family Households | 664 | 5,736 | 12,072 | |
Non-Family Households | 504 | 6,259 | 10,472 | |
Married Couple | 457 | 3,883 | 8,760 | |
Other Family | 207 | 1,853 | 3,311 | |
Married w/Child | 207 | 1,617 | 3,571 | |
Single Male w/Child | 64 | 465 | 795 | |
Single Female w/Child | 60 | 644 | 1,263 |
Population Change Last Two Decades - Plus Projection
2000 | % | 2010 | % | 2020 | % | 2030 | |
---|---|---|---|---|---|---|---|
Minnesota | 4,919,479 | +8 | 5,303,925 | +7 | 5,687,161 | +5 | 5,974,304 |
Le Sueur County | 25,426 | +9 | 27,703 | +2 | 28,193 | +1 | 28,469 |
Nicollet County | 29,771 | +10 | 32,727 | +4 | 33,965 | +2 | 34,748 |
Blue Earth County | 55,941 | +14 | 64,013 | +7 | 68,348 | +4 | 71,389 |
Total Working Age Population:
Total Households:
Total Working Age Population:
Total Households:
Total Working Age Population:
Total Households: