Commercial Land
Highway 126 Prineville, OR 97754
Highway 126 Prineville, OR 97754

Details & Description
Property Highlights
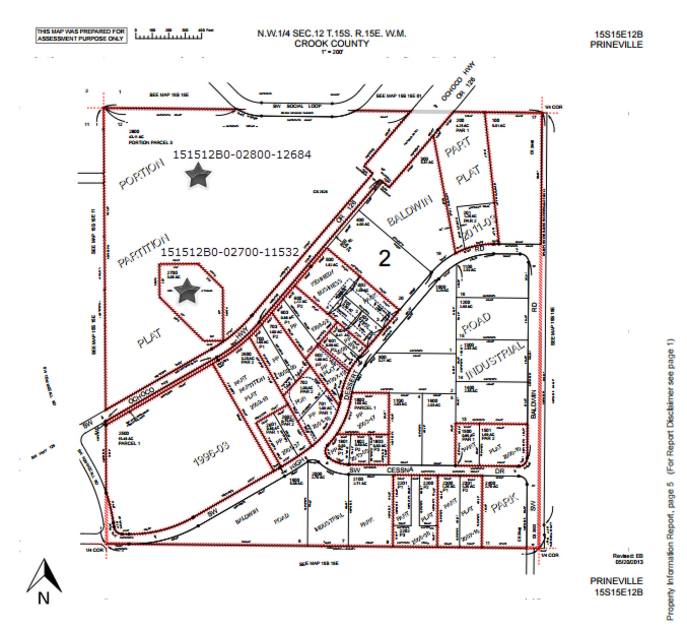
- • Two tax lots totaling 45.23
- • 80' right of way off Tom McCall Rd
- • Water and sewer along West property line
- • Gas and fiber along Tom McCall Rd
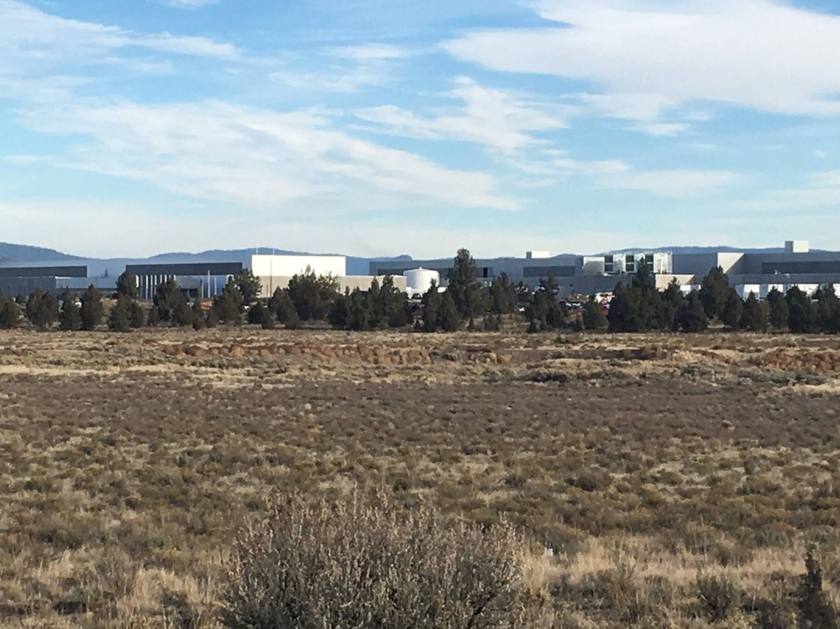
Additional Photos

Listing Agents

Jenn Limoges
O: 541-706-9370
M: 541-639-2566
jlimoges@naicascade.com
O: 541-706-9370
M: 541-639-2566
jlimoges@naicascade.com
While we strive to provide the most accurate information, all listing information, and demographic data, is provided by third-parties. As such, MyEListing will not be responsible for the accuracy of the information. It is strongly recommended that you verify all information with the listing agent, and any relevant agencies, prior to making any decisions.


