Industrial Properties
120 3rd Street Newport, KY 41071
120 3rd Street Newport, KY 41071

Details & Description
Property Highlights
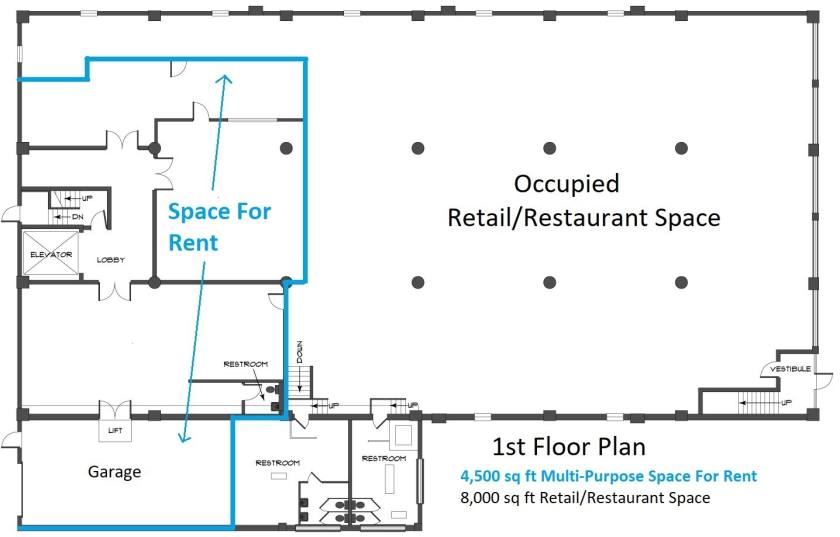
- • 1st floor: 4,500 sf warehouse space
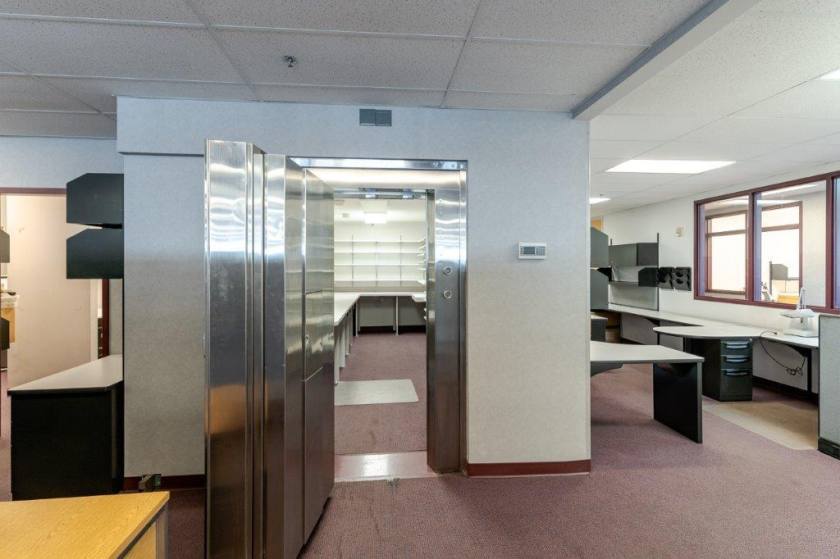
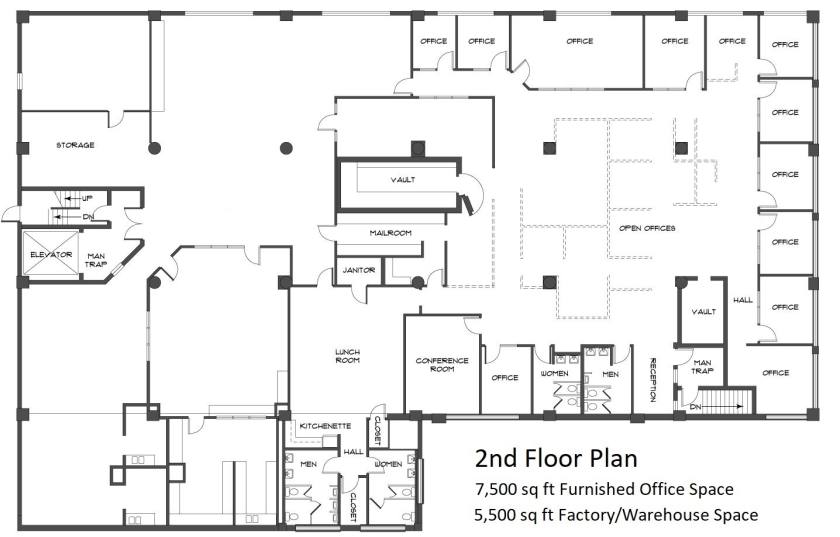
- • 2nd floor includes several safes
- • Located in Newport Entertainment District
- • East access to I-75/71
- • 20 minutes to CVG
Additional Photos


Listing Agents

Laurence Bergman
O: 513-322-6307
M: 513-515-5488
larry@bergmancommercial.com
O: 513-322-6307
M: 513-515-5488
larry@bergmancommercial.com
While we strive to provide the most accurate information, all listing information, and demographic data, is provided by third-parties. As such, MyEListing will not be responsible for the accuracy of the information. It is strongly recommended that you verify all information with the listing agent, and any relevant agencies, prior to making any decisions.