Retail Space
1303-1311 E Main St Barstow, CA 92311
1303-1311 E Main St Barstow, CA 92311
Details & Description
Property Highlights
- • Can accommodate a 30,000 SF Anchor
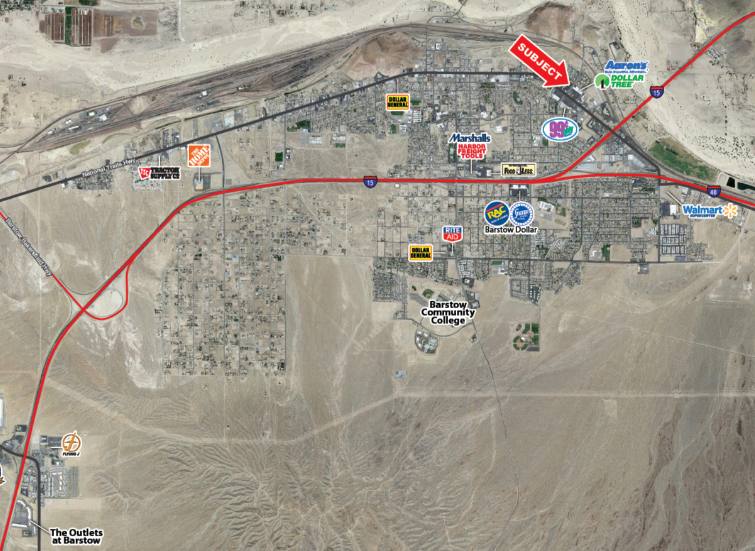
- • Highly visible pylon signage
- • Captures 15 Freeway tourist traffic
Listing Agents

Alfredo Arguello
O: 949-955-0391
M: 949-988-3205
aarguello@w-retail.com
O: 949-955-0391
M: 949-988-3205
aarguello@w-retail.com
While we strive to provide the most accurate information, all listing information, and demographic data, is provided by third-parties. As such, MyEListing will not be responsible for the accuracy of the information. It is strongly recommended that you verify all information with the listing agent, and any relevant agencies, prior to making any decisions.


