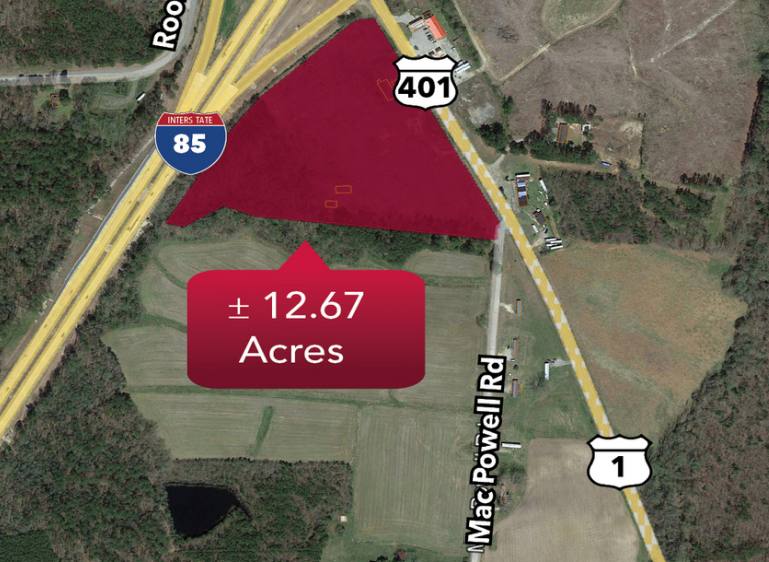
1-Mile | 3-Miles | 5-Miles | ||
---|---|---|---|---|
Total Population | 111 | 1,081 | 3,266 | |
Population Median Age | 43 | 43 | 44 | |
Population by Age | 0-9 Yrs | 5 (4%) | 74 (6%) | 266 (8%) |
10-19 Yrs | 26 (23%) | 220 (20%) | 564 (17%) | |
20-29 Yrs | 6 (5%) | 73 (6%) | 246 (7%) | |
30-39 Yrs | 18 (16%) | 136 (12%) | 371 (11%) | |
40-49 Yrs | 7 (6%) | 75 (6%) | 282 (8%) | |
50-59 Yrs | 9 (8%) | 117 (10%) | 331 (10%) | |
60-69 Yrs | 28 (25%) | 221 (20%) | 698 (21%) | |
70+ Yrs | 13 (11%) | 165 (15%) | 508 (15%) | |
Median HH Income | $32,323 | $35,933 | $39,529 | |
Total Household Income | < 24K | 16 (29%) | 176 (35%) | 481 (33%) |
25-49K | 19 (35%) | 121 (24%) | 351 (24%) | |
50-74K | 10 (18%) | 90 (18%) | 280 (19%) | |
75-99K | 2 (3%) | 27 (5%) | 109 (7%) | |
100-199K | 6 (11%) | 68 (13%) | 212 (14%) | |
200K+ | 1 (1%) | 8 (1%) | 21 (1%) | |
Highest Education Level | No Diploma | 18 | 124 | 330 |
Diploma or GED | 34 | 346 | 1029 | |
Some College | 9 | 104 | 348 | |
Assoc. Degree | 3 | 46 | 137 | |
Bachelors Degree | 7 | 85 | 293 | |
Higher Degree | 4 | 30 | 124 | |
Total Housing Units | 74 | 709 | 2,901 | |
--Owner-Occupied | 36 | 323 | 998 | |
--Renter-Occupied | 18 | 167 | 456 | |
Owner-Occupied Values | < 100K | 26 | 200 | 538 |
100-199K | 7 | 80 | 229 | |
200-299K | 2 | 21 | 107 | |
300-399K | 1 | 13 | 51 | |
400-499K | 0 | 5 | 30 | |
500K+ | 0 | 6 | 44 | |
Total Working Age Population | 101 | 961 | 2,864 | |
In Work Force | 60 | 529 | 1,554 | |
Not In Work Force | 41 | 432 | 1,310 | |
Workforce Employed | 55 | 457 | 1,354 | |
Workforce Unemployed | 5 | 72 | 200 | |
Civlian Workforce | 60 | 529 | 1,554 | |
Military Workforce | 0 | 0 | 0 | |
Total Households | 54 | 490 | 1,454 | |
Family Households | 32 | 291 | 880 | |
Non-Family Households | 22 | 199 | 574 | |
Married Couple | 18 | 175 | 581 | |
Other Family | 14 | 116 | 299 | |
Married w/Child | 3 | 49 | 155 | |
Single Male w/Child | 1 | 12 | 38 | |
Single Female w/Child | 10 | 62 | 150 |
Population Change Last Two Decades - Plus Projection
2000 | % | 2010 | % | 2020 | % | 2030 | |
---|---|---|---|---|---|---|---|
North Carolina | 8,049,313 | +18 | 9,535,483 | +11 | 10,630,691 | +11 | 11,836,070 |
Warren County | 19,972 | +5 | 20,972 | -5 | 19,898 | -5 | 18,885 |
Virginia | 7,078,515 | +13 | 8,001,024 | +8 | 8,655,021 | +8 | 9,331,666 |
Mecklenburg County | 32,380 | +1 | 32,727 | -6 | 30,691 | -4 | 29,527 |
Total Working Age Population:
Total Households:
Total Working Age Population:
Total Households:
Total Working Age Population:
Total Households: