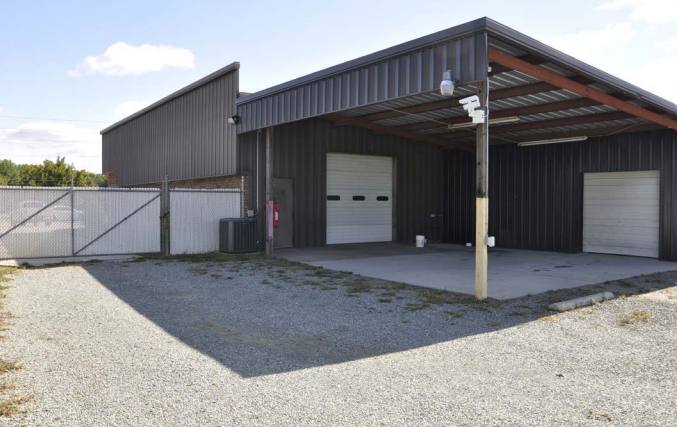
Flex-Office-Warehouse
200 Wilson Road Sanford, NC 27332
200 Wilson Road Sanford, NC 27332
Details & Description
Property Highlights
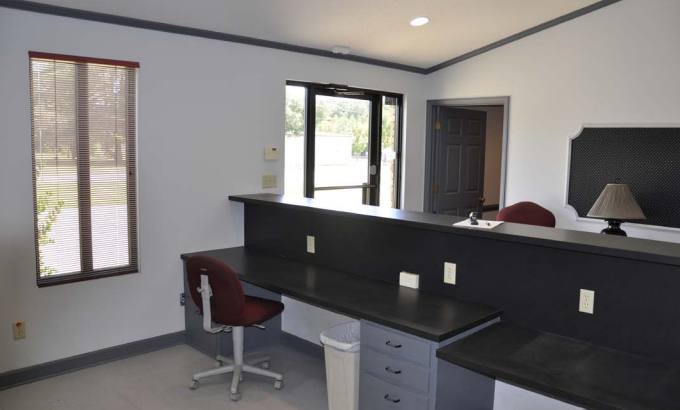
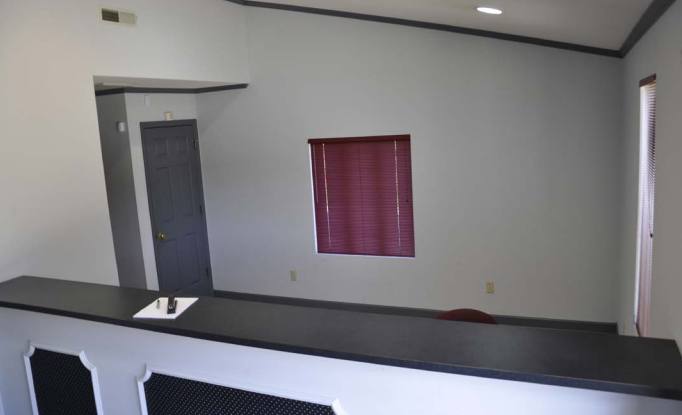
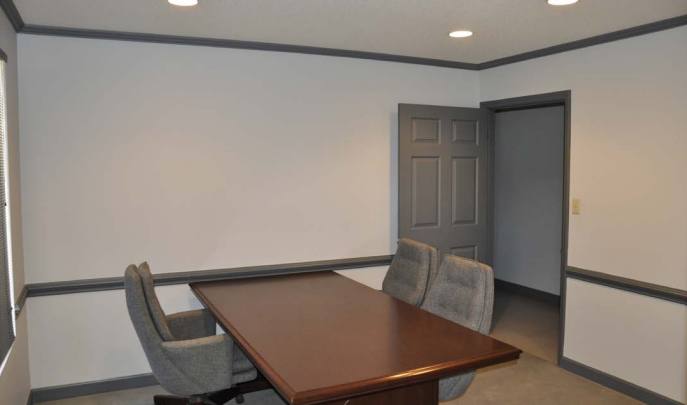
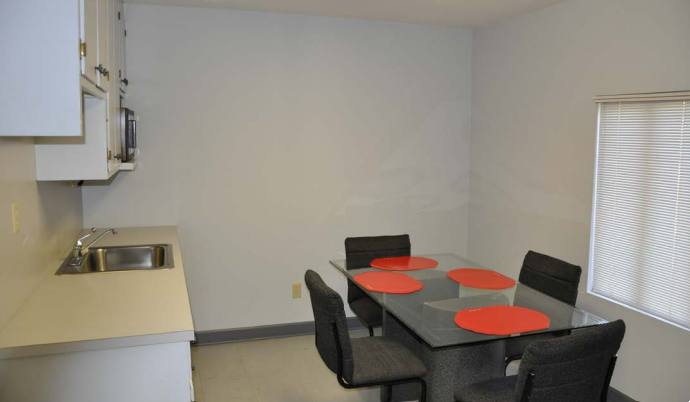
- • ±3,910 SF office with rear yard space
- • 2.84 Acres
- • Zoned LI (light industrial)
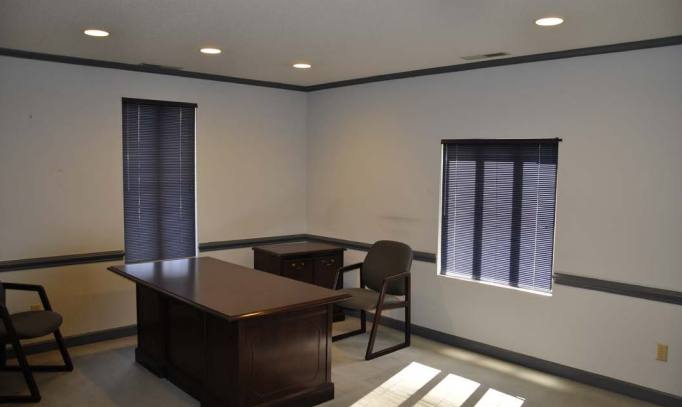
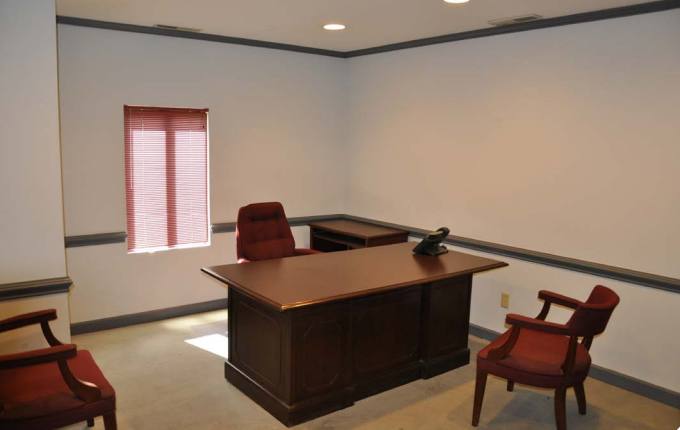
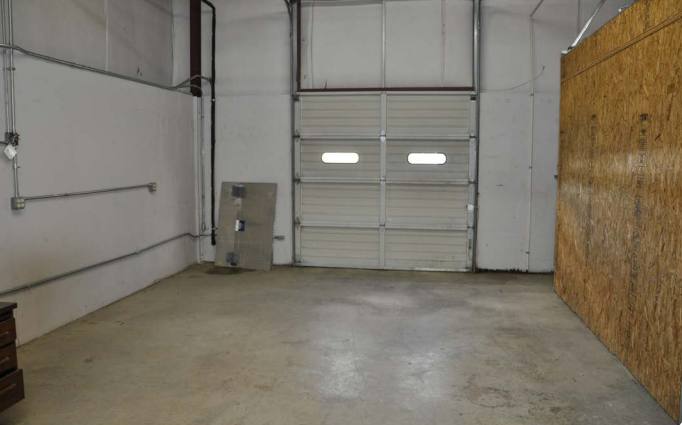
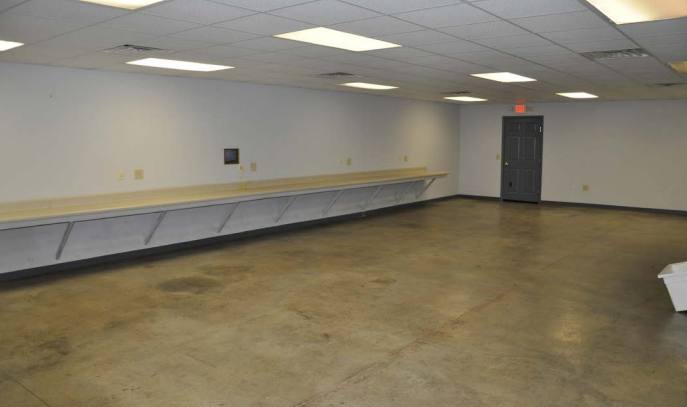
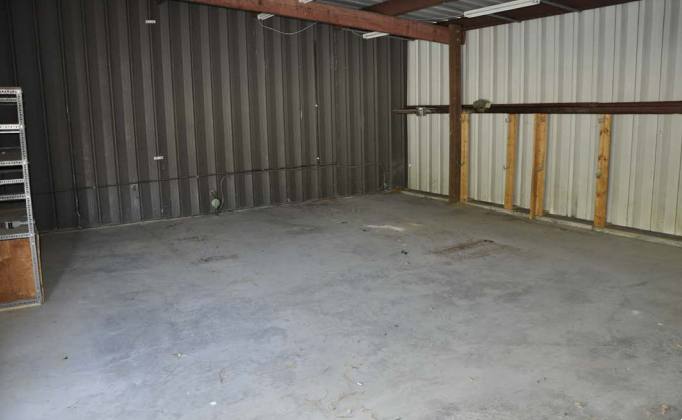
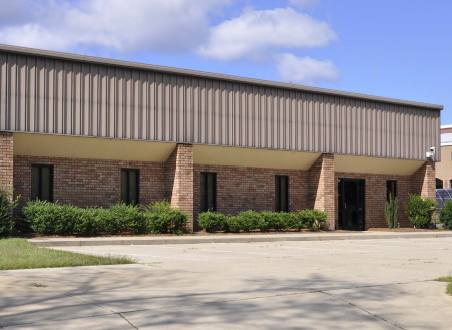
Additional Photos
Listing Agents

Hunter Stewart
O: 919-576-2507
M: 919-548-3172
hstewart@lee-associates.com
O: 919-576-2507
M: 919-548-3172
hstewart@lee-associates.com

Scott Hadley
O: 919-576-2504
M: 919-906-0524
shadley@lee-associates.com
O: 919-576-2504
M: 919-906-0524
shadley@lee-associates.com
While we strive to provide the most accurate information, all listing information, and demographic data, is provided by third-parties. As such, MyEListing will not be responsible for the accuracy of the information. It is strongly recommended that you verify all information with the listing agent, and any relevant agencies, prior to making any decisions.