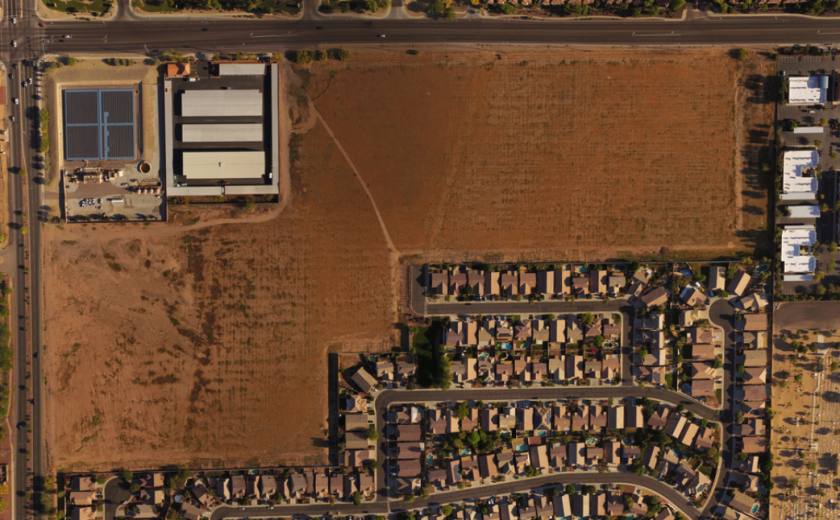
Commercial Land
SEC Indian School Rd and Dysart Rd Avondale, AZ 85392
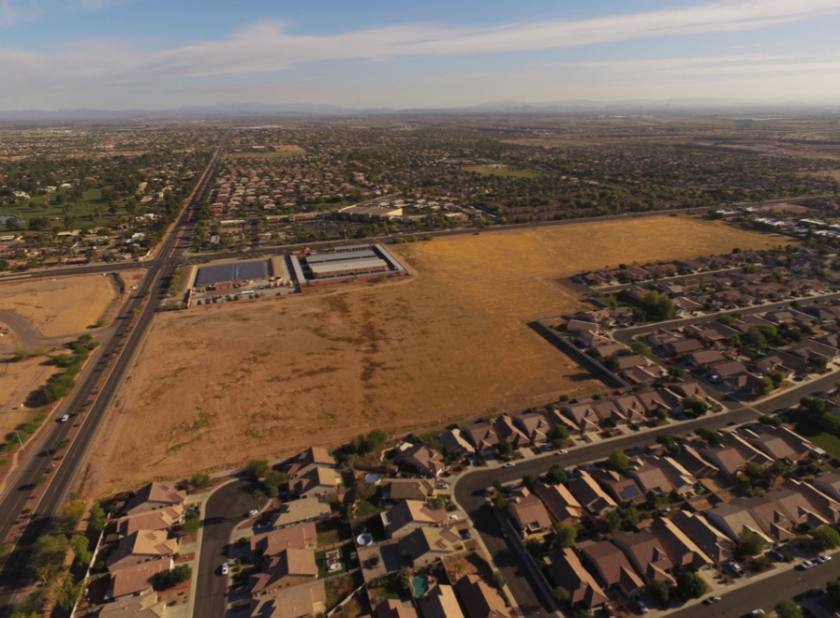
SEC Indian School Rd and Dysart Rd Avondale, AZ 85392
Details & Description
Property Highlights
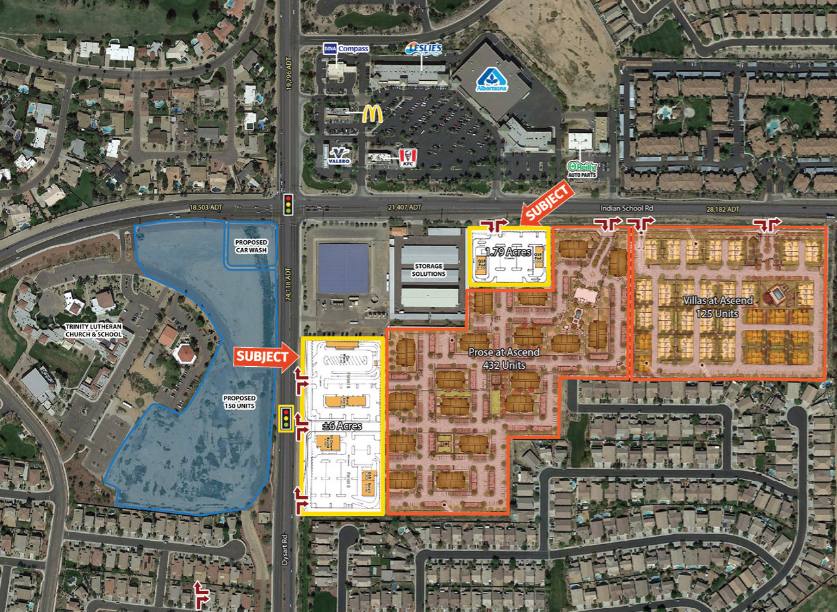
- • Pasadera Center
- • Zoned: PAD C-2
- • Available for ground Lease, Sale or BTS
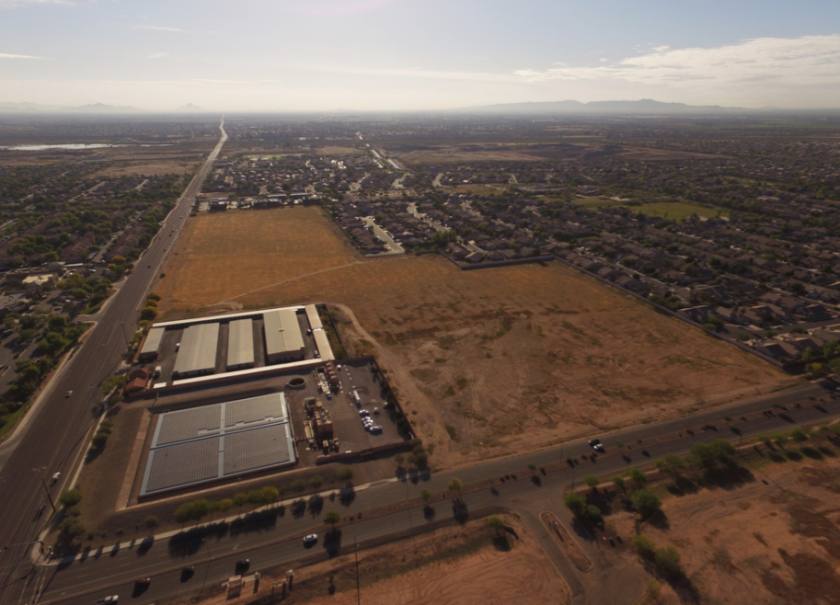
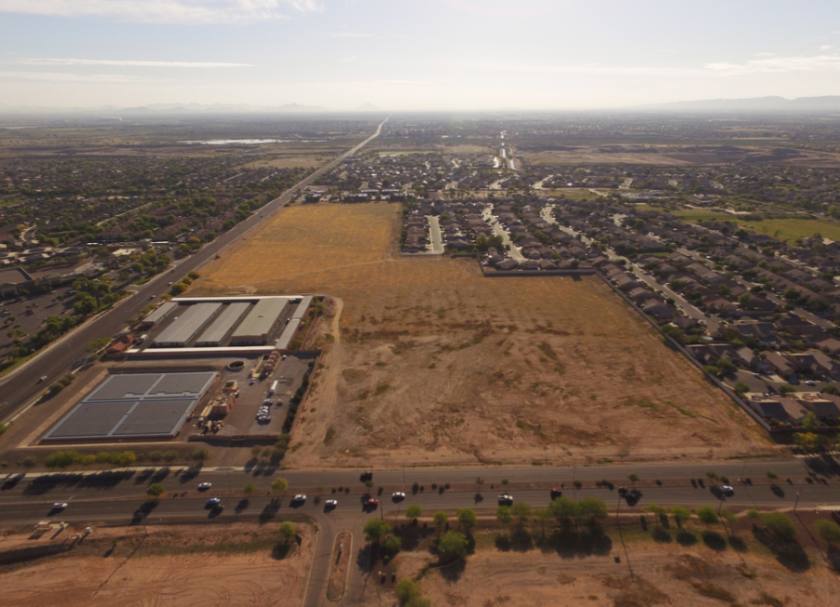
Additional Photos

Listing Agents

Brian Gausden
O: 602-778-3740
bgausden@w-retail.com
O: 602-778-3740
bgausden@w-retail.com

Jake McClaughry
O: 602-368-1088
jmcclaughry@w-retail.com
O: 602-368-1088
jmcclaughry@w-retail.com

Noah Anastassatos
Western Retail Advisors
M: 602-778-3747
nanastassatos@w-retail.com
Western Retail Advisors
M: 602-778-3747
nanastassatos@w-retail.com
While we strive to provide the most accurate information, all listing information, and demographic data, is provided by third-parties. As such, MyEListing will not be responsible for the accuracy of the information. It is strongly recommended that you verify all information with the listing agent, and any relevant agencies, prior to making any decisions.