Office Space
1900 Broad Street- East of Broad Offices FuquayVarina, NC 27526
1900 Broad Street- East of Broad Offices FuquayVarina, NC 27526
Details & Description
Property Highlights
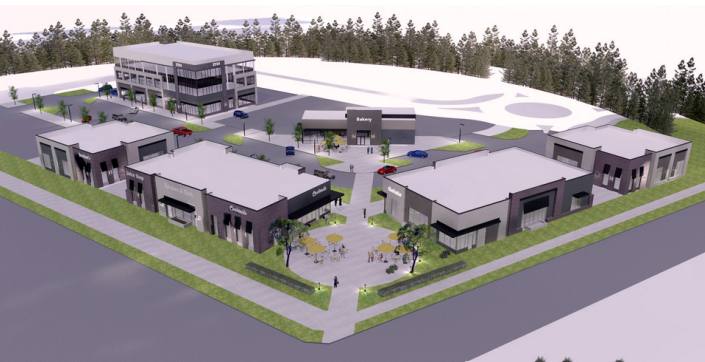
• Ability to add a second 30,000 SF up to 40,000 SF office building adjacent with 165 parking spaces (up to 5.5/1
• Over 3,000 single-family residential homes under construction in Holly Springs and Fuquay-Varina
Listing Agents

Moss Withers
O: 919-576-2501
M: 919-810-2492
mwithers@lee-associates.com
O: 919-576-2501
M: 919-810-2492
mwithers@lee-associates.com

Karah Jennings McConnell
O: 919-576-2502
M: 919-817-0705
kjennings@lee-associates.com
O: 919-576-2502
M: 919-817-0705
kjennings@lee-associates.com
While we strive to provide the most accurate information, all listing information, and demographic data, is provided by third-parties. As such, MyEListing will not be responsible for the accuracy of the information. It is strongly recommended that you verify all information with the listing agent, and any relevant agencies, prior to making any decisions.