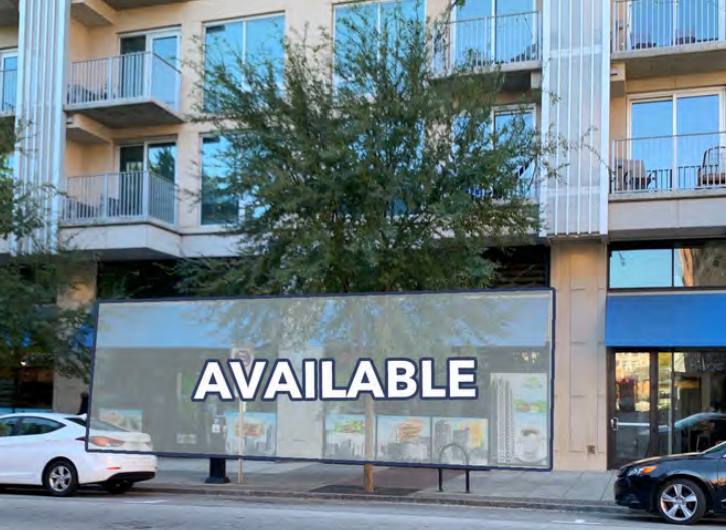
Retail Space
124 East Martin Street Raleigh, NC 27601
124 East Martin Street Raleigh, NC 27601
Details & Description
Property Highlights
• Strong daytime population- 2,581 Businesses with 29,192 Employees and 37,347 Total Daytime Population within 1 mi radiu
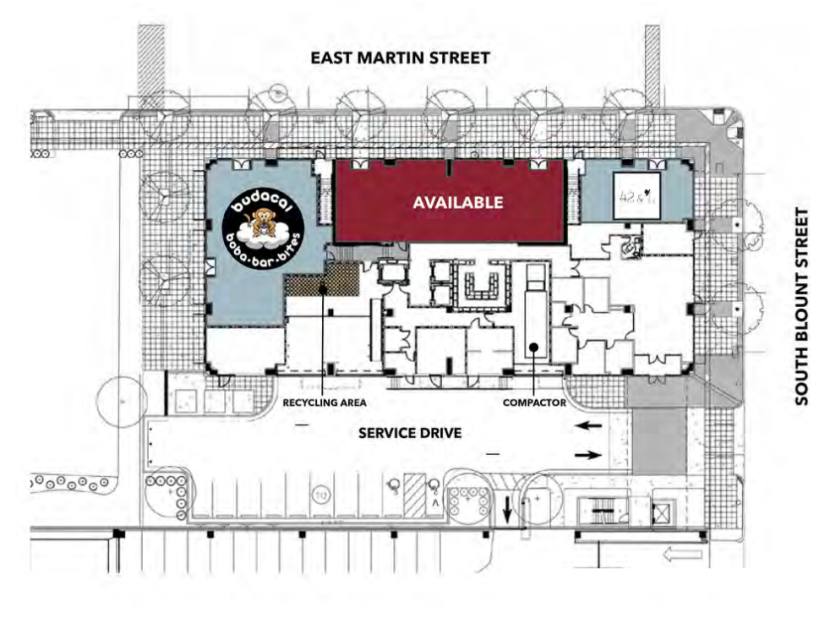
• Walking distance to city, county and state government buildings, as well as restaurants, museums, and galleries
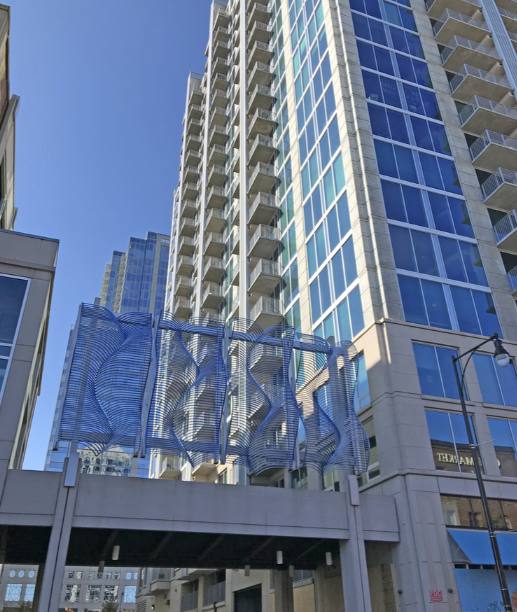
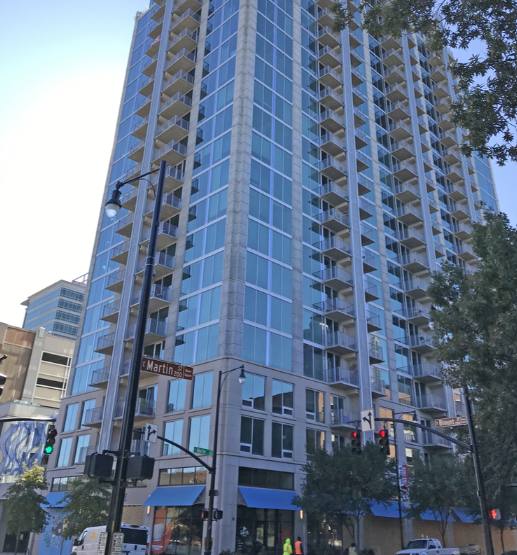
Additional Photos
Listing Agents

Jenn Olevitch-Roberson
O: 919-576-2517
M: 919-345-1752
jolevitch-roberson@lee-associates.com
O: 919-576-2517
M: 919-345-1752
jolevitch-roberson@lee-associates.com

Chip Lanier
Lee and Associates
O: 919-576-2516
M: 919-291-6282
clanier@lee-associates.com
Lee and Associates
O: 919-576-2516
M: 919-291-6282
clanier@lee-associates.com
While we strive to provide the most accurate information, all listing information, and demographic data, is provided by third-parties. As such, MyEListing will not be responsible for the accuracy of the information. It is strongly recommended that you verify all information with the listing agent, and any relevant agencies, prior to making any decisions.


