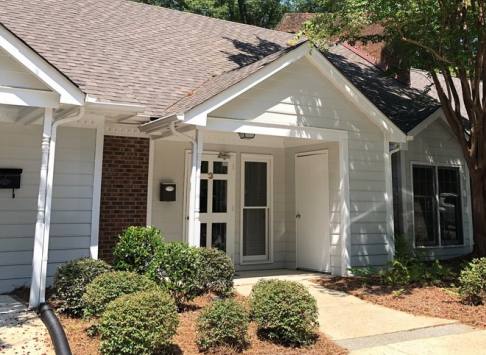
Office Space
1148 Executive Circle Cary, NC 27511
1148 Executive Circle Cary, NC 27511
Details & Description
Property Highlights
- • Available March 1, 2023
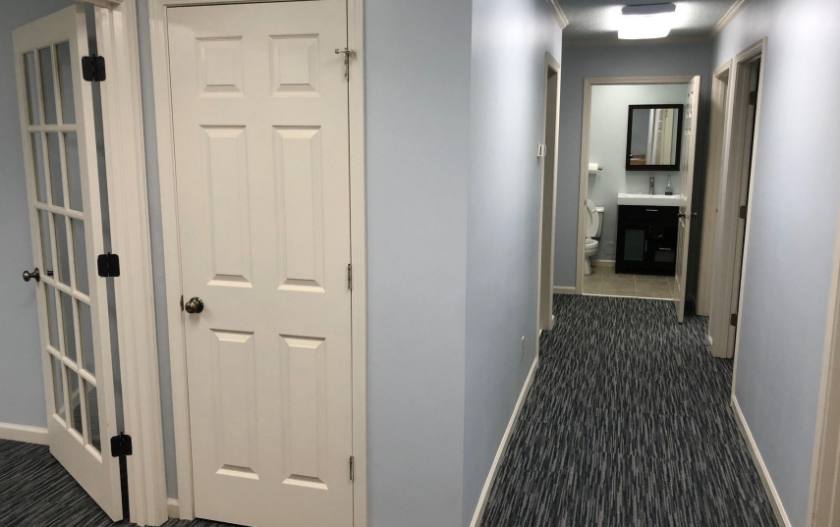
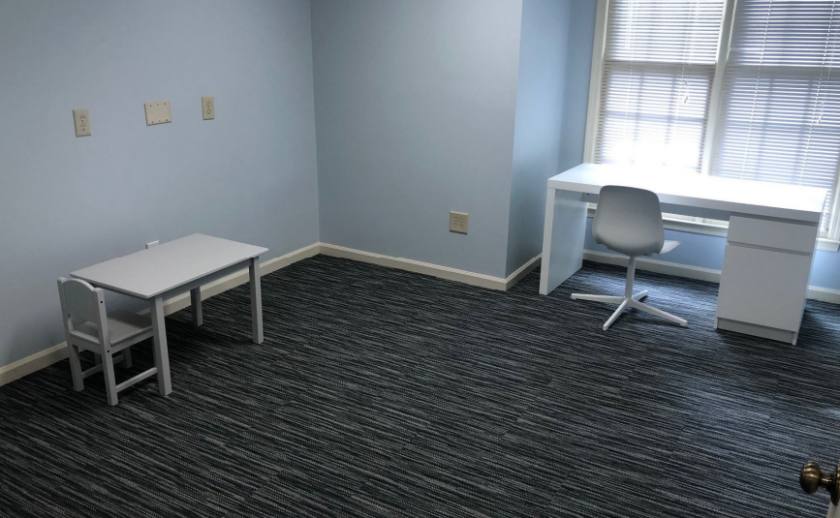
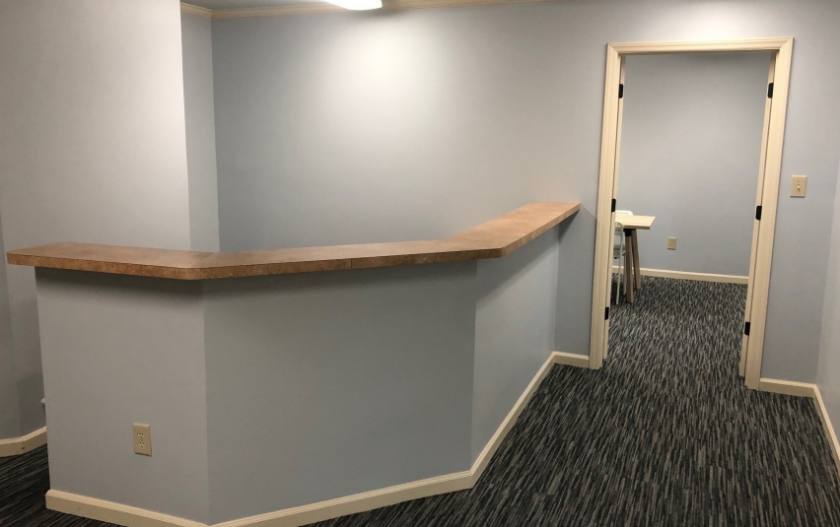
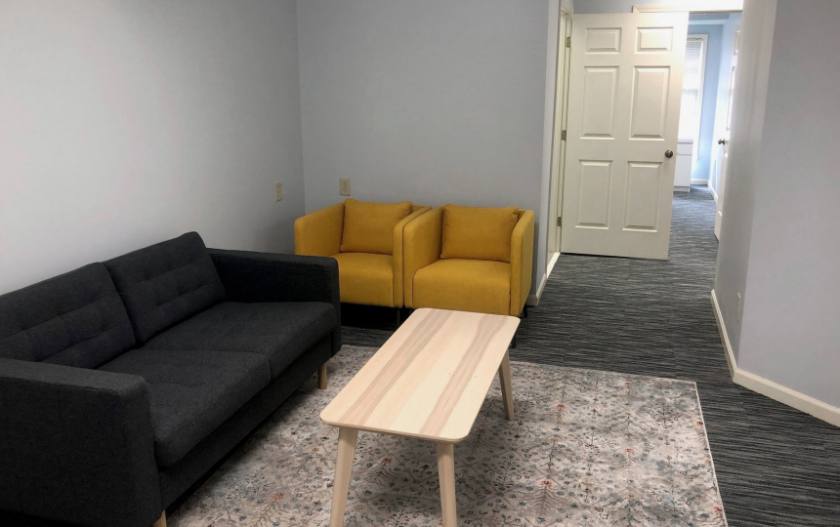
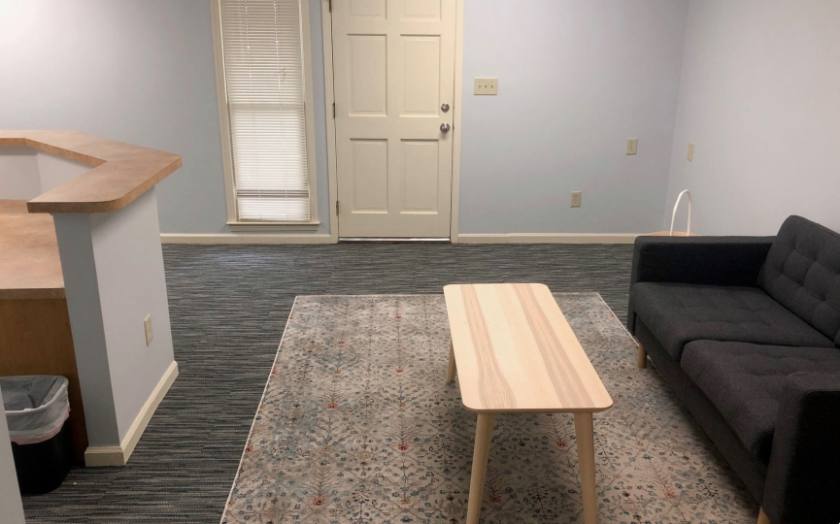
- • New carpet and fresh paint
- • Ample restaurants and retail nearby
Additional Photos
Listing Agents

Moss Withers
O: 919-576-2501
M: 919-810-2492
mwithers@lee-associates.com
O: 919-576-2501
M: 919-810-2492
mwithers@lee-associates.com

Stone Alexander
O: 919-591-2275
M: 919-600-2397
salexander@lee-associates.com
O: 919-591-2275
M: 919-600-2397
salexander@lee-associates.com

Karah Jennings McConnell
O: 919-576-2502
M: 919-817-0705
kjennings@lee-associates.com
O: 919-576-2502
M: 919-817-0705
kjennings@lee-associates.com
While we strive to provide the most accurate information, all listing information, and demographic data, is provided by third-parties. As such, MyEListing will not be responsible for the accuracy of the information. It is strongly recommended that you verify all information with the listing agent, and any relevant agencies, prior to making any decisions.