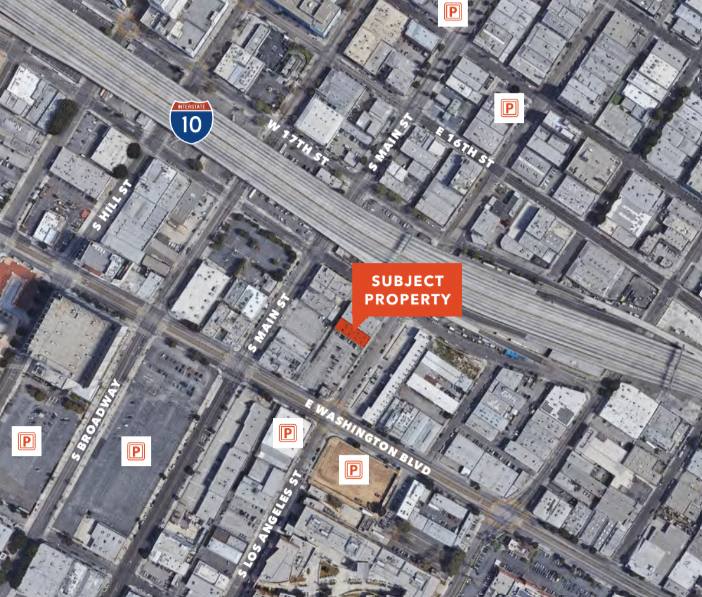
Industrial Properties
1733 South Los Angeles Street Los Angeles, CA 90015
1733 South Los Angeles Street Los Angeles, CA 90015
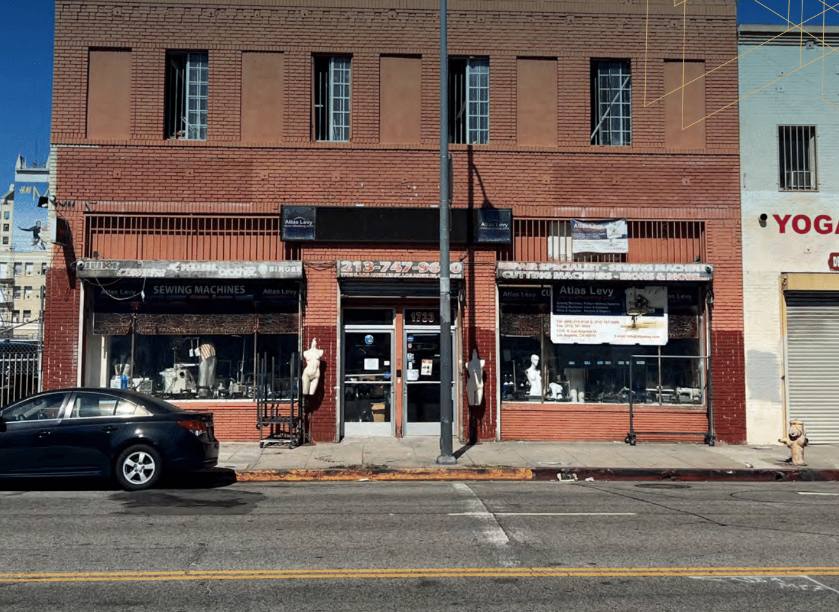
Details & Description
Property Highlights
- • POWER 3 PHASE, 240V, 600 AMP
- • 1 DRIVE IN LOADING DOOR
- • 1,200 LB FREIGHT ELEVATOR
Additional Photos


Listing Agents

John Anthony
O: 213-225-7218
M: 213-507-5570
john.anthony@kidder.com
O: 213-225-7218
M: 213-507-5570
john.anthony@kidder.com

Christopher Steck
O: 213-225-7231
christopher.steck@kidder.com
O: 213-225-7231
christopher.steck@kidder.com

Christopher Giordano
Kidder Mathews
O: 213-225-7219
christopher.giordano@kidder.com
Kidder Mathews
O: 213-225-7219
christopher.giordano@kidder.com
While we strive to provide the most accurate information, all listing information, and demographic data, is provided by third-parties. As such, MyEListing will not be responsible for the accuracy of the information. It is strongly recommended that you verify all information with the listing agent, and any relevant agencies, prior to making any decisions.


