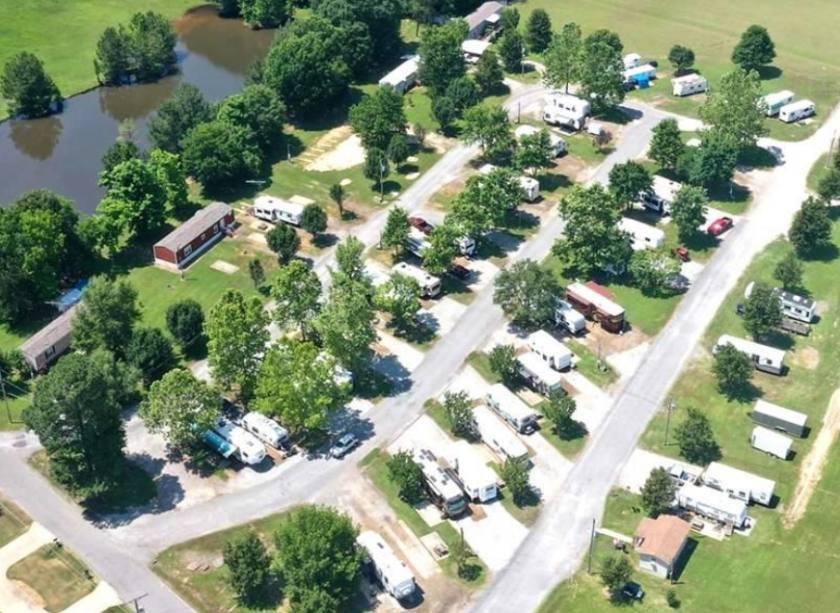
Commercial Land
597 Whitney Lane Kensett, AR 72082
597 Whitney Lane Kensett, AR 72082
Details & Description
Property Highlights
- • Public Water & Sewer
- • Below Market Rates with Revenue Upside
- • 72-Site Expansion Opportunity
- • 50 miles to downtown Little Rock
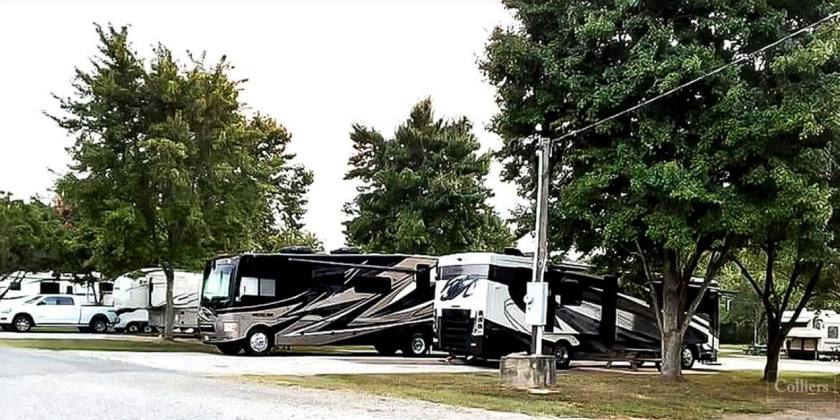
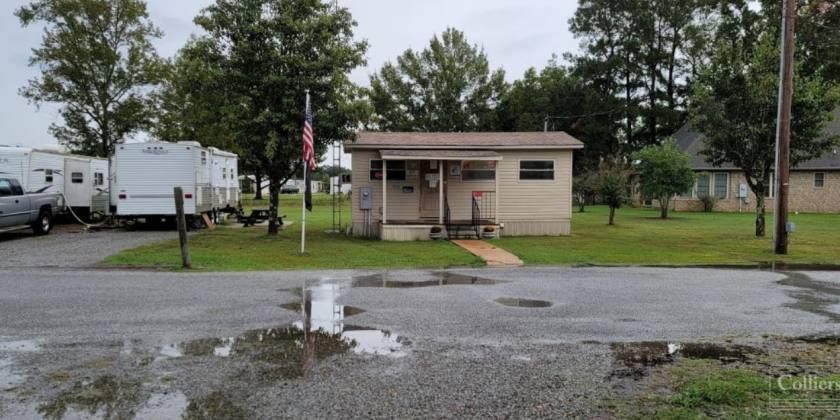
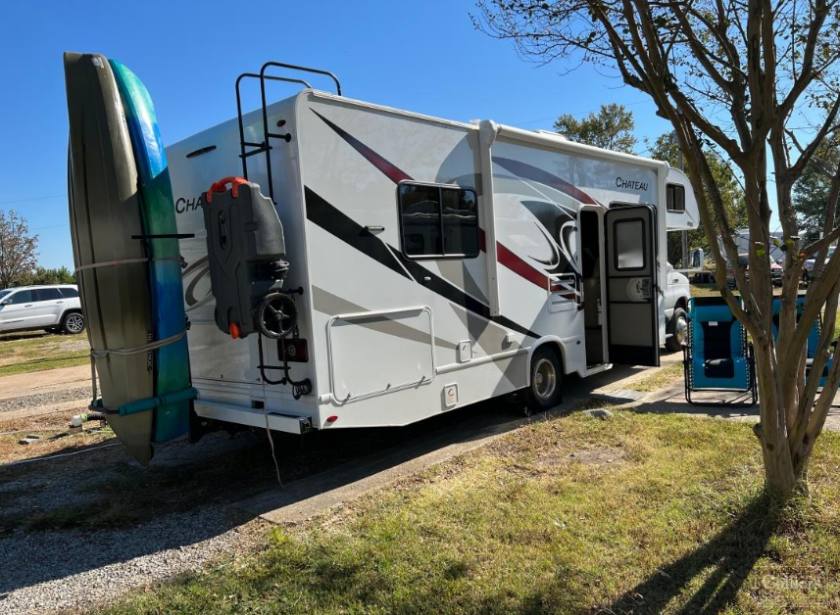
Additional Photos

Listing Agents

Michael Nissley
O: 561-479-1588
M: 561-479-1588
Mike.Nissley@colliers.com
O: 561-479-1588
M: 561-479-1588
Mike.Nissley@colliers.com
While we strive to provide the most accurate information, all listing information, and demographic data, is provided by third-parties. As such, MyEListing will not be responsible for the accuracy of the information. It is strongly recommended that you verify all information with the listing agent, and any relevant agencies, prior to making any decisions.


