Industrial Properties
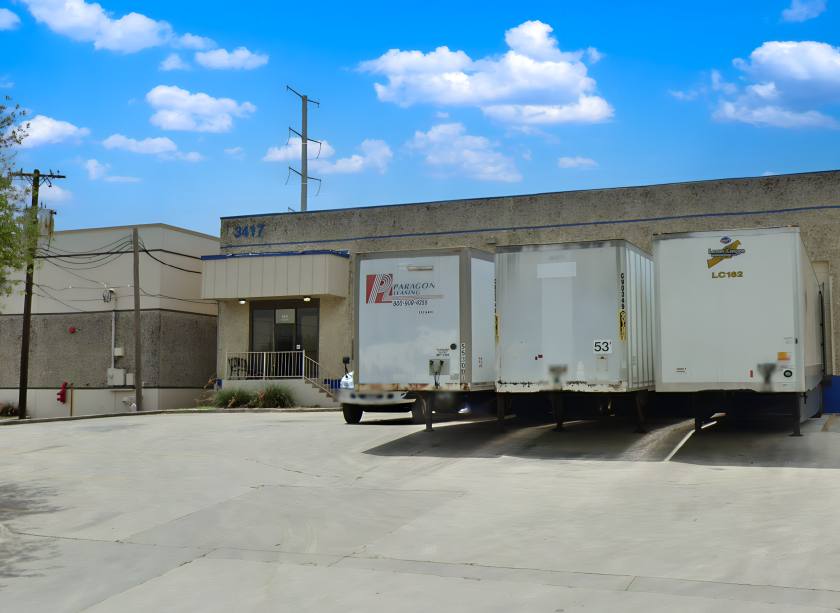
3417 Steen Street San Antonio, TX 78219
3417 Steen Street San Antonio, TX 78219
Details & Description
Property Highlights
- • 85% Warehouse
- • 19’ Clear Height
- • 83”Truck Court Depth
- • End Cap Space
- • 15% Office
- • Front Loading / 3 Dock High Doors
Listing Agents

Charlie Hargis
O: 210-918-6388
M: 210-286-4536
chargis@endurasa.com
O: 210-918-6388
M: 210-286-4536
chargis@endurasa.com
While we strive to provide the most accurate information, all listing information, and demographic data, is provided by third-parties. As such, MyEListing will not be responsible for the accuracy of the information. It is strongly recommended that you verify all information with the listing agent, and any relevant agencies, prior to making any decisions.