Office Space
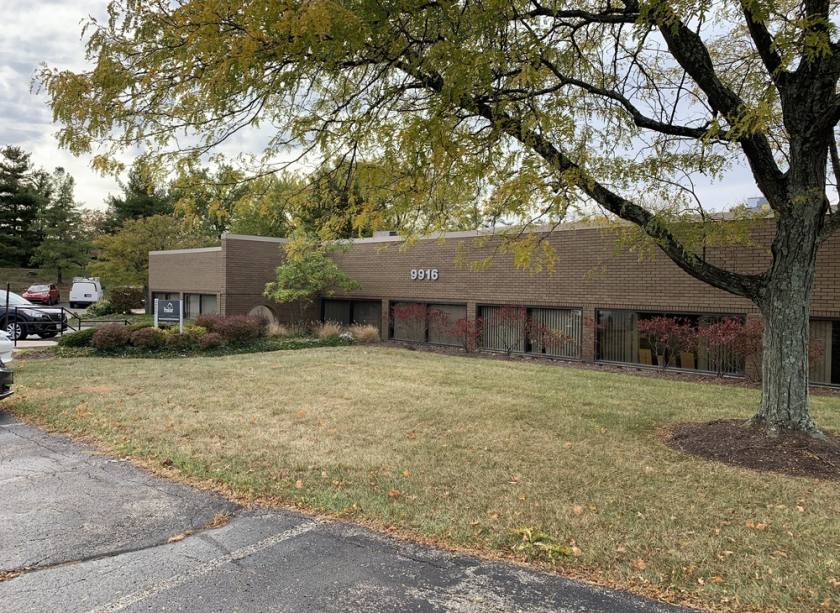
9916-9918 Carver Road Blue Ash, OH 45242
9916-9918 Carver Road Blue Ash, OH 45242
Details & Description
Property Highlights
- • $16.00 Modified Gross
- • Easy Access to Reed Hartman and I-71
- • Single Story Building with Drive Up Accessibility
- • Abundant Parking
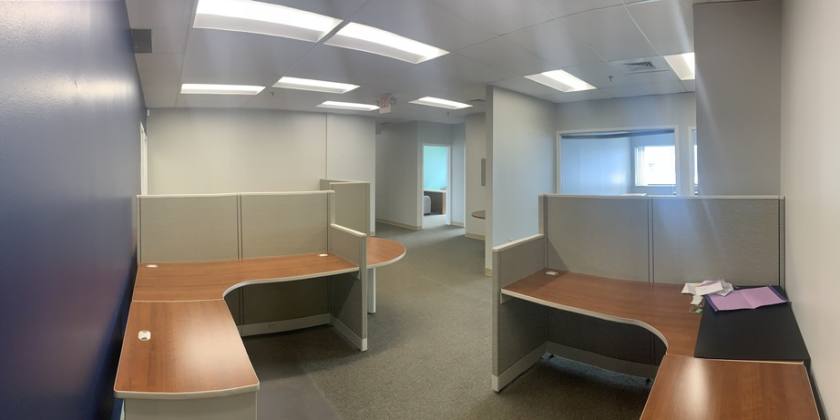
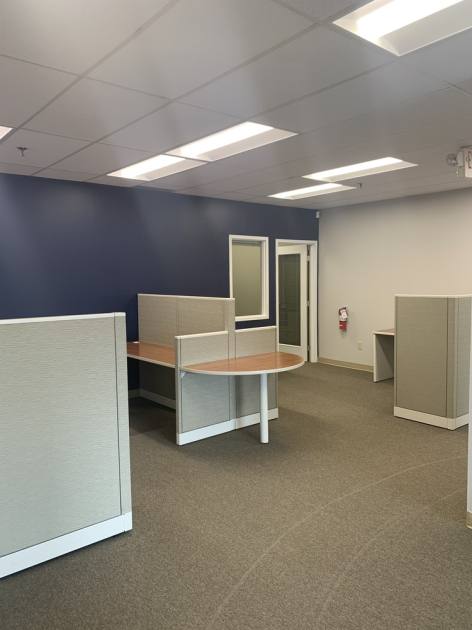
- • Furniture Available
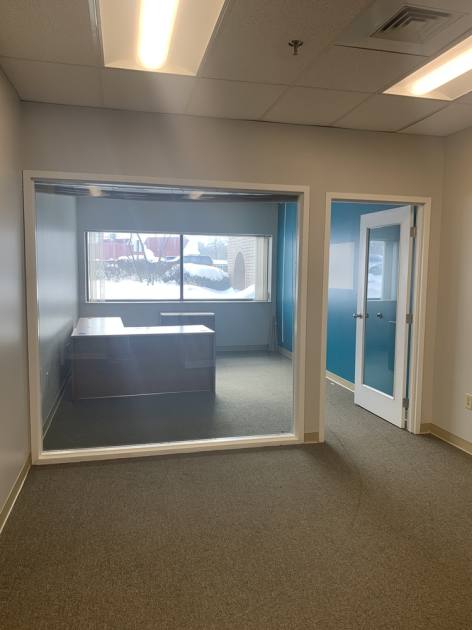
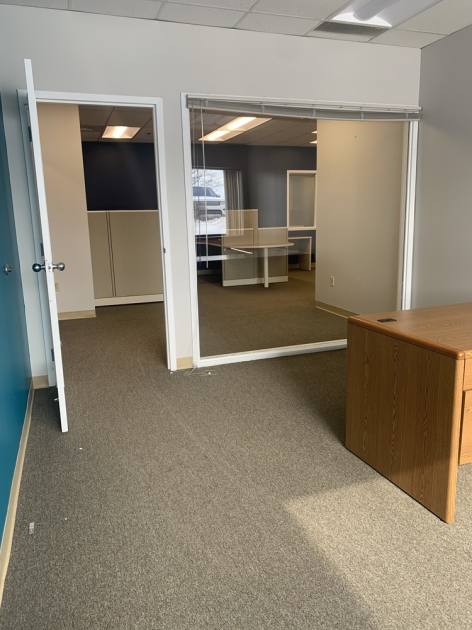
Additional Photos
Listing Agents

Matt Hiudt
O: 513-322-6310
M: 513-479-2050
mhiudt@bergmancommercial.com
O: 513-322-6310
M: 513-479-2050
mhiudt@bergmancommercial.com
While we strive to provide the most accurate information, all listing information, and demographic data, is provided by third-parties. As such, MyEListing will not be responsible for the accuracy of the information. It is strongly recommended that you verify all information with the listing agent, and any relevant agencies, prior to making any decisions.


