Commercial Land
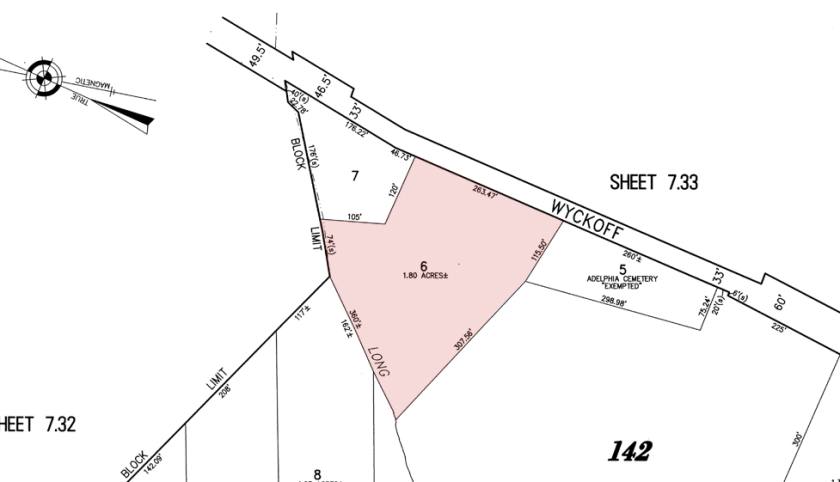
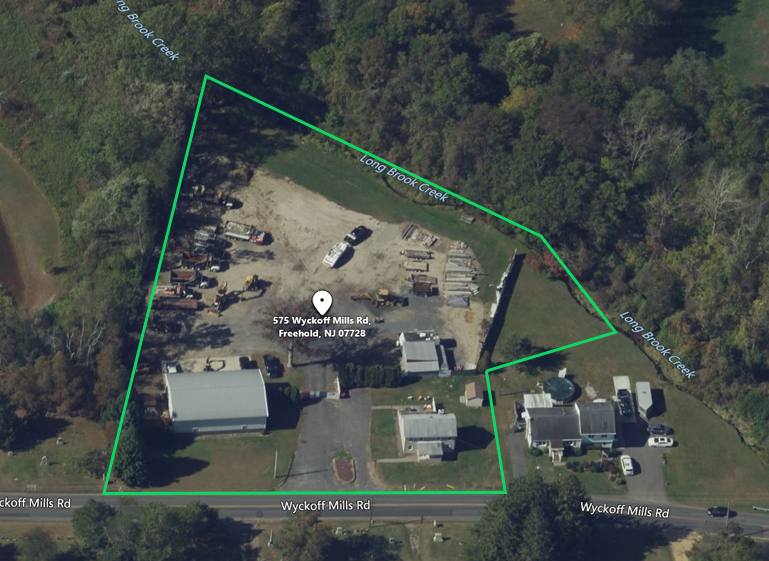
575 Wyckoff Mills Road Freehold, NJ 07728
575 Wyckoff Mills Road Freehold, NJ 07728
Details & Description
Property Highlights
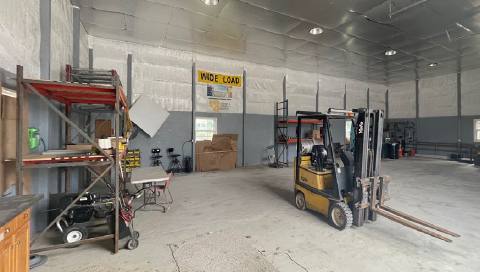
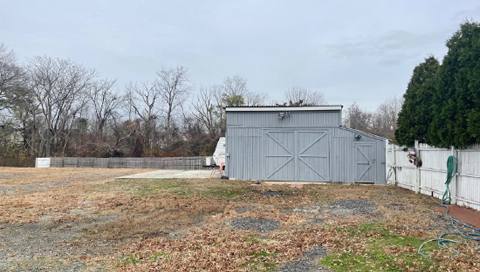
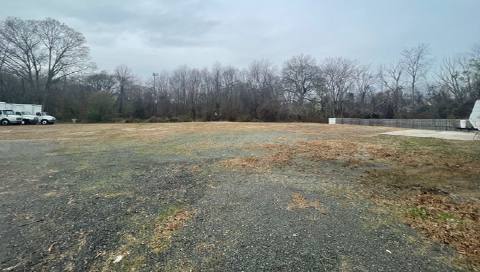
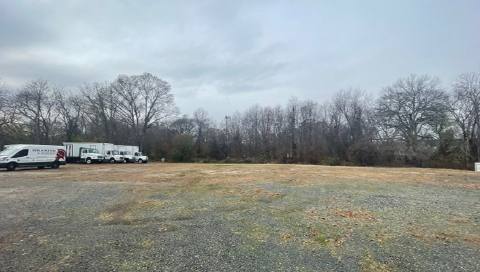
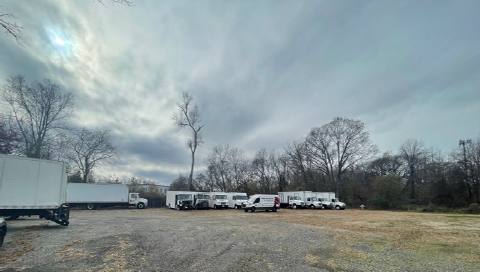
• ±2,400 SF Pole Barn / Shop with House on ±1.83 Acres
• ±2,400 SF Pole Barn / Shop with House on ±1.83 Acres
Additional Photos
Listing Agents

Christopher Chiusolo
O: 973-379-6644
M: 973-970-0703
cchiusolo@blauberg.com
O: 973-379-6644
M: 973-970-0703
cchiusolo@blauberg.com
While we strive to provide the most accurate information, all listing information, and demographic data, is provided by third-parties. As such, MyEListing will not be responsible for the accuracy of the information. It is strongly recommended that you verify all information with the listing agent, and any relevant agencies, prior to making any decisions.