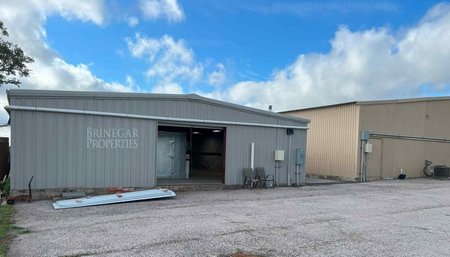
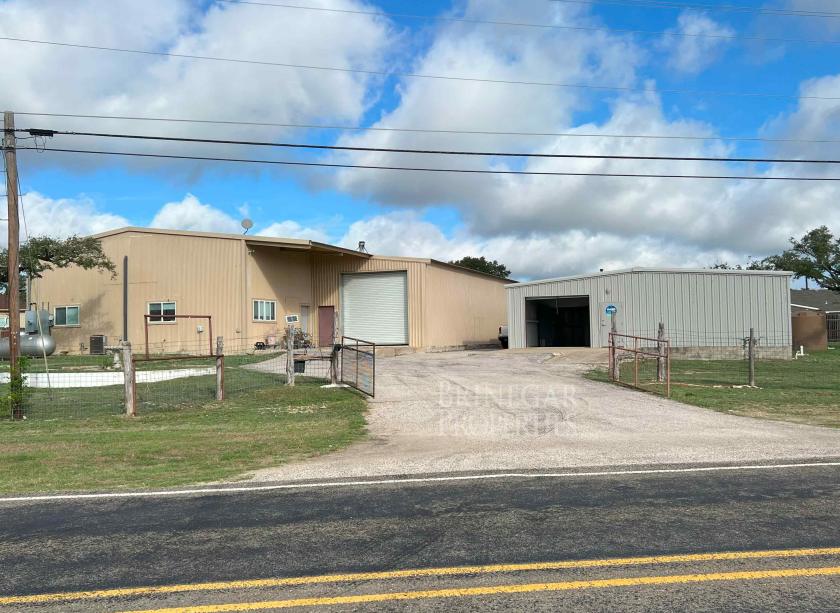
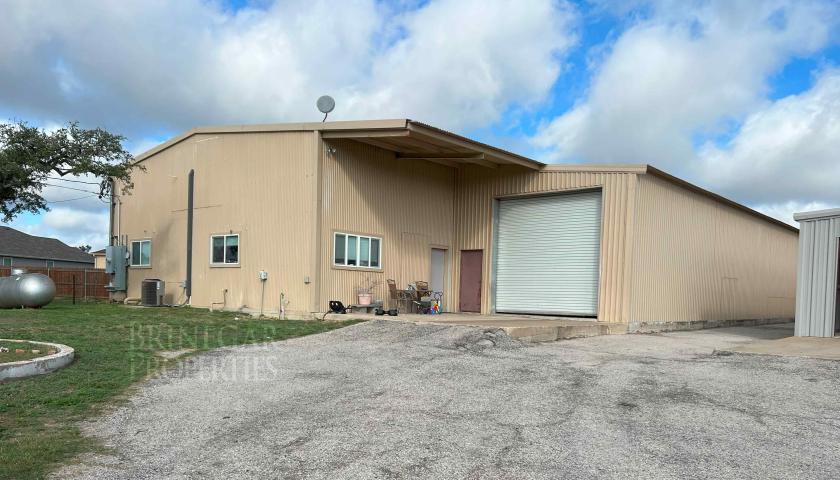
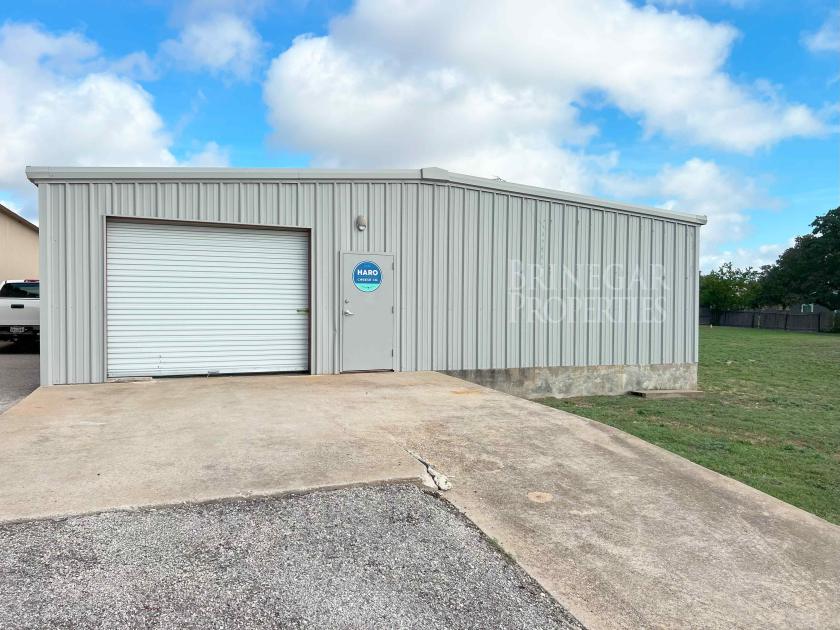
Flex-Office-Warehouse
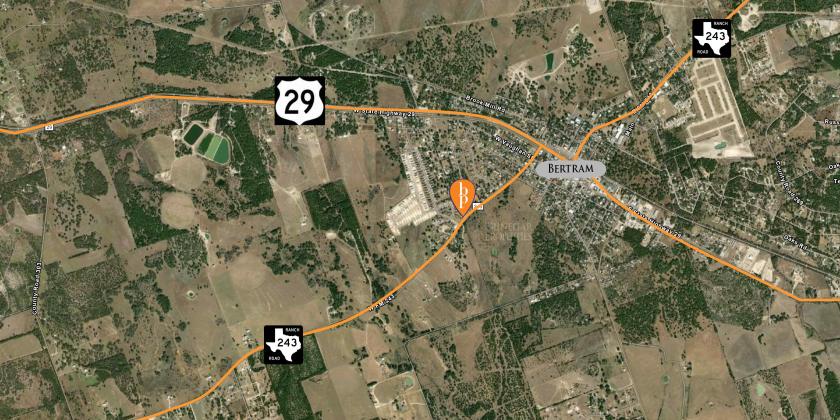
630 West Farm to Market Road 243 Bertram, TX 78605
630 West Farm to Market Road 243 Bertram, TX 78605
Details & Description
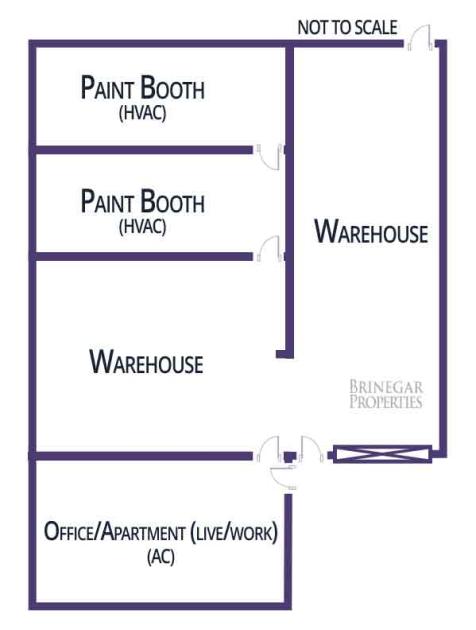
Property Highlights
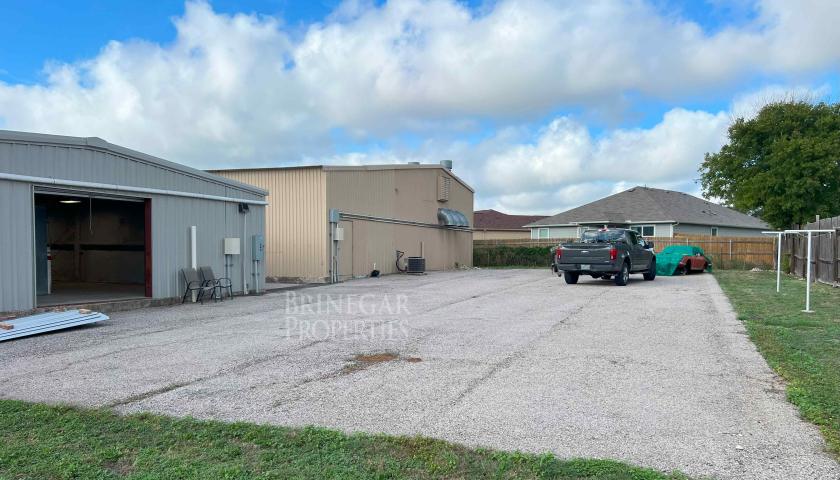
• Partial HVAC in Warehouse
• Potential for Live/Work
Additional Photos

Listing Agents

Brentley Brinegar
O: 512-940-0188
bb@512texas.com
O: 512-940-0188
bb@512texas.com
While we strive to provide the most accurate information, all listing information, and demographic data, is provided by third-parties. As such, MyEListing will not be responsible for the accuracy of the information. It is strongly recommended that you verify all information with the listing agent, and any relevant agencies, prior to making any decisions.