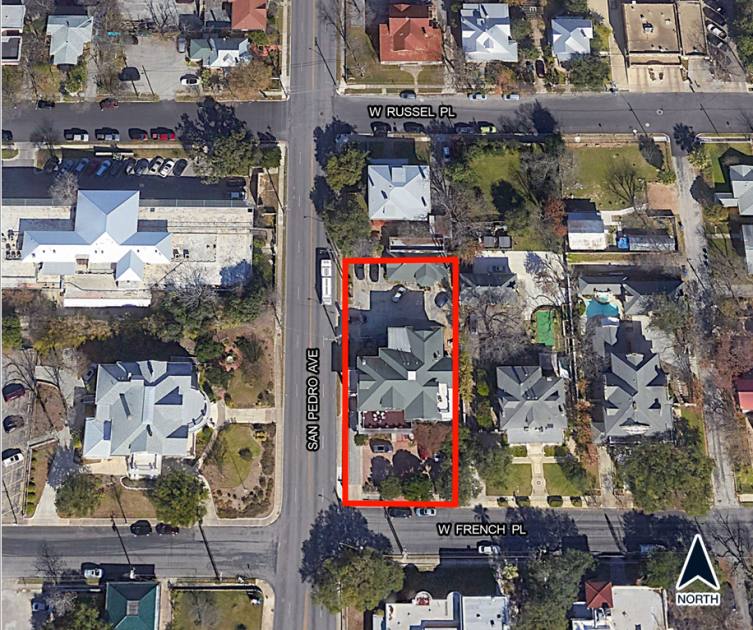
1-Mile | 3-Miles | 5-Miles | ||
---|---|---|---|---|
Total Population | 16,041 | 144,108 | 395,786 | |
Population Median Age | 40 | 38 | 37 | |
Population by Age | 0-9 Yrs | 1093 (6%) | 16350 (11%) | 52409 (13%) |
10-19 Yrs | 2052 (12%) | 19175 (13%) | 55604 (14%) | |
20-29 Yrs | 2465 (15%) | 24175 (16%) | 60732 (15%) | |
30-39 Yrs | 2430 (15%) | 21120 (14%) | 56262 (14%) | |
40-49 Yrs | 2634 (16%) | 17506 (12%) | 47712 (12%) | |
50-59 Yrs | 1955 (12%) | 17894 (12%) | 48915 (12%) | |
60-69 Yrs | 1566 (9%) | 14301 (9%) | 37650 (9%) | |
70+ Yrs | 1844 (11%) | 13587 (9%) | 36503 (9%) | |
Median HH Income | $43,714 | $42,331 | $41,917 | |
Total Household Income | < 24K | 1875 (28%) | 15947 (32%) | 42007 (31%) |
25-49K | 1873 (28%) | 12168 (24%) | 33418 (25%) | |
50-74K | 1218 (18%) | 7982 (16%) | 22644 (17%) | |
75-99K | 501 (7%) | 4439 (8%) | 12637 (9%) | |
100-199K | 747 (11%) | 6156 (12%) | 14708 (11%) | |
200K+ | 351 (5%) | 2895 (5%) | 6168 (4%) | |
Highest Education Level | No Diploma | 1942 | 26548 | 66470 |
Diploma or GED | 3135 | 25110 | 71952 | |
Some College | 2438 | 17489 | 51708 | |
Assoc. Degree | 660 | 5348 | 13878 | |
Bachelors Degree | 1958 | 12621 | 30819 | |
Higher Degree | 1681 | 9966 | 22761 | |
Total Housing Units | 7,811 | 57,666 | 148,456 | |
--Owner-Occupied | 2,580 | 22,812 | 66,668 | |
--Renter-Occupied | 3,985 | 26,775 | 64,916 | |
Owner-Occupied Values | < 100K | 469 | 8705 | 29316 |
100-199K | 855 | 6982 | 20962 | |
200-299K | 504 | 2515 | 5877 | |
300-399K | 237 | 1282 | 3201 | |
400-499K | 162 | 1011 | 2102 | |
500K+ | 354 | 2318 | 5209 | |
Total Working Age Population | 14,032 | 117,645 | 311,917 | |
In Work Force | 8,460 | 69,923 | 183,403 | |
Not In Work Force | 5,572 | 47,722 | 128,514 | |
Workforce Employed | 8,026 | 64,326 | 168,689 | |
Workforce Unemployed | 409 | 4,638 | 12,286 | |
Civlian Workforce | 8,434 | 68,964 | 180,975 | |
Military Workforce | 25 | 959 | 2,428 | |
Total Households | 6,565 | 49,587 | 131,584 | |
Family Households | 2,671 | 26,484 | 76,420 | |
Non-Family Households | 3,893 | 23,103 | 55,164 | |
Married Couple | 1,785 | 16,076 | 44,287 | |
Other Family | 886 | 10,408 | 32,132 | |
Married w/Child | 630 | 6,020 | 17,694 | |
Single Male w/Child | 116 | 782 | 2,387 | |
Single Female w/Child | 184 | 3,846 | 12,423 |
Population Change Last Two Decades - Plus Projection
2000 | % | 2010 | % | 2020 | % | 2030 | |
---|---|---|---|---|---|---|---|
Texas | 20,851,820 | +21 | 25,145,561 | +18 | 29,677,668 | +18 | 34,894,452 |
Bexar County | 1,392,931 | +23 | 1,714,773 | +22 | 2,093,502 | +20 | 2,502,617 |
Total Working Age Population:
Total Households:
Total Working Age Population:
Total Households:
Total Working Age Population:
Total Households: