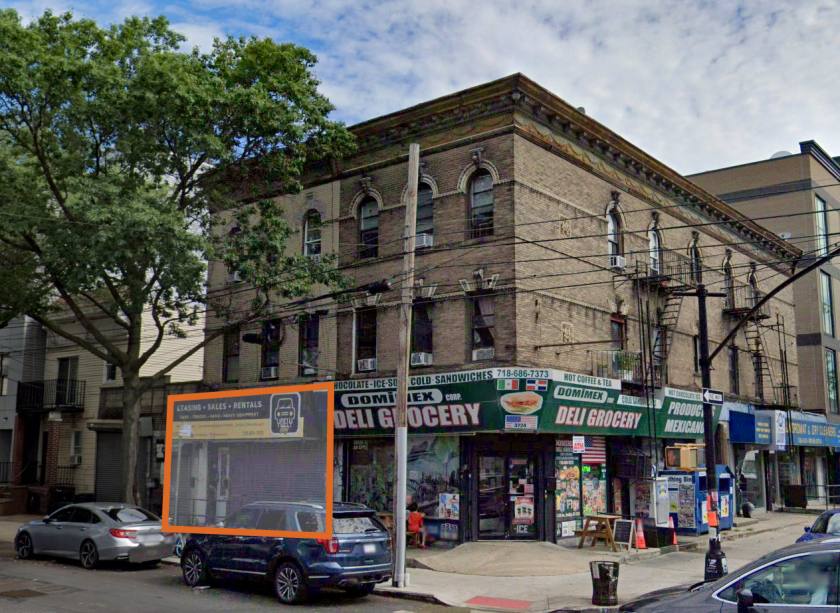
1-Mile | 3-Miles | 5-Miles | ||
---|---|---|---|---|
Total Population | 151,352 | 1,112,740 | 2,278,970 | |
Population Median Age | 33 | 37 | 38 | |
Population by Age | 0-9 Yrs | 31408 (20%) | 159233 (14%) | 306993 (13%) |
10-19 Yrs | 23510 (15%) | 131179 (11%) | 258808 (11%) | |
20-29 Yrs | 20095 (13%) | 156389 (14%) | 341261 (14%) | |
30-39 Yrs | 20621 (13%) | 181255 (16%) | 361404 (15%) | |
40-49 Yrs | 17377 (11%) | 142366 (12%) | 286059 (12%) | |
50-59 Yrs | 13577 (8%) | 128300 (11%) | 267037 (11%) | |
60-69 Yrs | 13395 (8%) | 111590 (10%) | 233823 (10%) | |
70+ Yrs | 11368 (7%) | 102427 (9%) | 223585 (9%) | |
Median HH Income | $56,306 | $69,248 | $65,555 | |
Total Household Income | < 24K | 10913 (23%) | 80158 (19%) | 198360 (23%) |
25-49K | 9914 (21%) | 74076 (18%) | 155280 (18%) | |
50-74K | 7101 (15%) | 58823 (14%) | 118959 (13%) | |
75-99K | 5376 (11%) | 47921 (11%) | 95440 (11%) | |
100-199K | 8990 (19%) | 94273 (23%) | 193773 (22%) | |
200K+ | 3618 (7%) | 45710 (11%) | 97781 (11%) | |
Highest Education Level | No Diploma | 20746 | 139611 | 267280 |
Diploma or GED | 24062 | 177904 | 379556 | |
Some College | 9897 | 92109 | 200995 | |
Assoc. Degree | 3552 | 42106 | 95848 | |
Bachelors Degree | 16592 | 177763 | 371609 | |
Higher Degree | 12329 | 131015 | 262954 | |
Total Housing Units | 49,890 | 434,987 | 935,717 | |
--Owner-Occupied | 14,202 | 129,397 | 274,221 | |
--Renter-Occupied | 31,711 | 271,564 | 585,371 | |
Owner-Occupied Values | < 100K | 213 | 4011 | 8806 |
100-199K | 247 | 3118 | 8142 | |
200-299K | 590 | 5026 | 12237 | |
300-399K | 815 | 6648 | 17851 | |
400-499K | 1010 | 8648 | 22754 | |
500K+ | 11328 | 101946 | 204432 | |
Total Working Age Population | 104,302 | 868,763 | 1,807,708 | |
In Work Force | 64,094 | 564,695 | 1,146,411 | |
Not In Work Force | 40,209 | 304,068 | 661,298 | |
Workforce Employed | 60,334 | 531,456 | 1,072,650 | |
Workforce Unemployed | 3,743 | 33,057 | 72,933 | |
Civlian Workforce | 64,077 | 564,513 | 1,145,583 | |
Military Workforce | 17 | 182 | 828 | |
Total Households | 45,912 | 400,961 | 859,593 | |
Family Households | 32,975 | 260,054 | 528,540 | |
Non-Family Households | 12,937 | 140,907 | 331,052 | |
Married Couple | 25,851 | 178,932 | 336,646 | |
Other Family | 7,124 | 81,122 | 191,894 | |
Married w/Child | 14,720 | 84,729 | 150,408 | |
Single Male w/Child | 433 | 6,261 | 13,126 | |
Single Female w/Child | 1,970 | 23,306 | 58,814 |
Population Change Last Two Decades - Plus Projection
2000 | % | 2010 | % | 2020 | % | 2030 | |
---|---|---|---|---|---|---|---|
New Jersey | 8,414,350 | +4 | 8,791,894 | +4 | 9,132,700 | +4 | 9,530,900 |
Hudson County | 608,975 | +4 | 634,266 | +12 | 708,100 | +6 | 747,400 |
New York | 18,976,457 | +2 | 19,378,102 | +4 | 20,146,131 | +2 | 20,604,030 |
Richmond County | 443,728 | +6 | 468,730 | +3 | 481,351 | +1 | 488,119 |
Kings County | 2,465,326 | +2 | 2,504,700 | +9 | 2,738,283 | +5 | 2,863,996 |
New York County | 1,537,195 | +3 | 1,585,873 | +6 | 1,688,894 | +2 | 1,727,631 |
Total Working Age Population:
Total Households:
Total Working Age Population:
Total Households:
Total Working Age Population:
Total Households: