Specialty Real Estate
537 East 91st Street Brooklyn, NY 11236
537 East 91st Street Brooklyn, NY 11236

Details & Description
Property Highlights
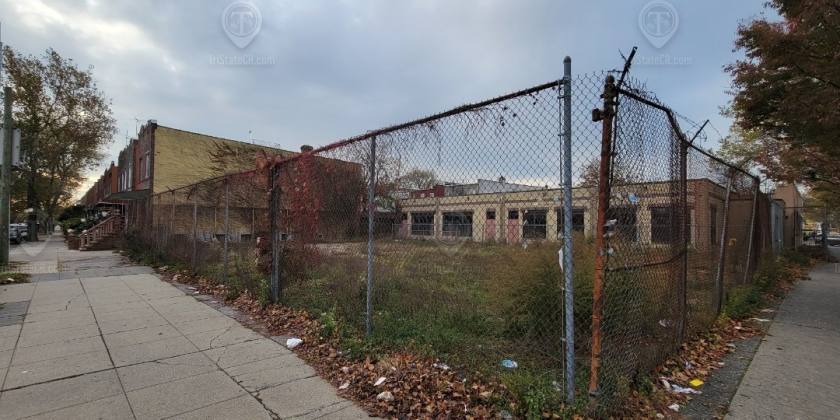
- • 230 feet of wraparound frontage
- • 3 floors build to suit medical office space
- • 43 parking spaces
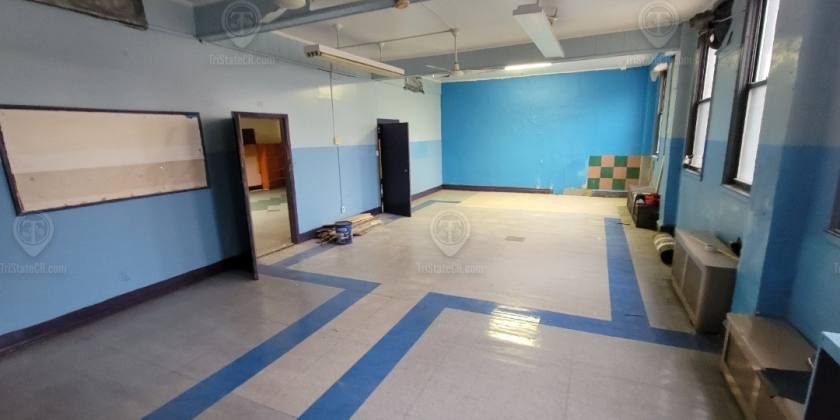
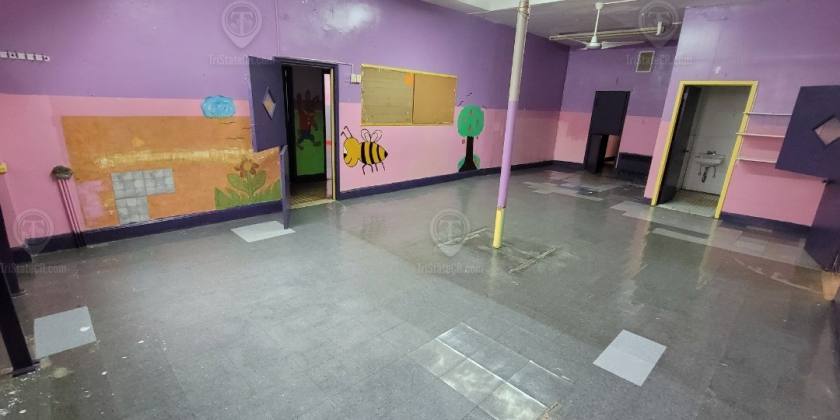
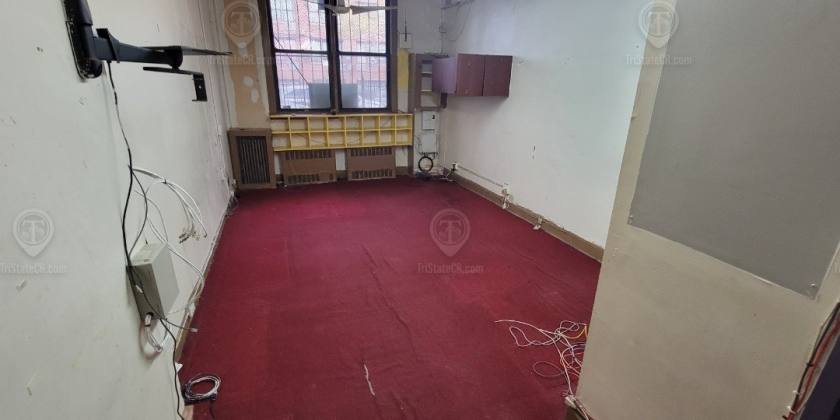
Additional Photos


Listing Agents

Shlomi Bagdadi
O: 718-437-6100
info@tristatecr.com
O: 718-437-6100
info@tristatecr.com
While we strive to provide the most accurate information, all listing information, and demographic data, is provided by third-parties. As such, MyEListing will not be responsible for the accuracy of the information. It is strongly recommended that you verify all information with the listing agent, and any relevant agencies, prior to making any decisions.