Industrial Properties
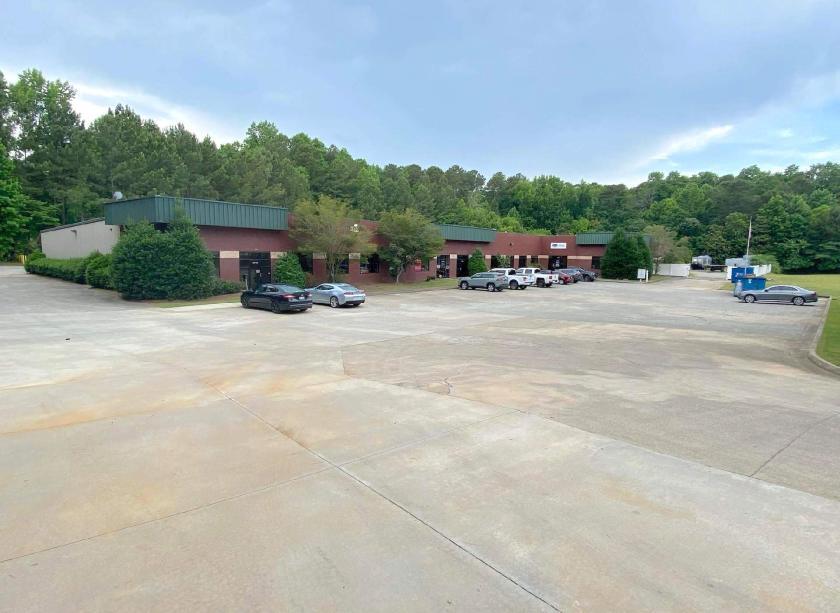
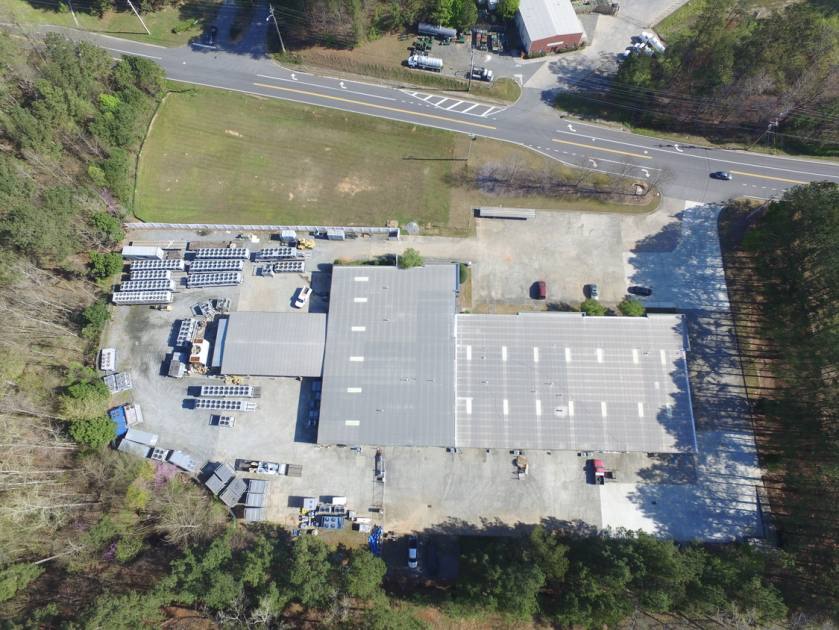
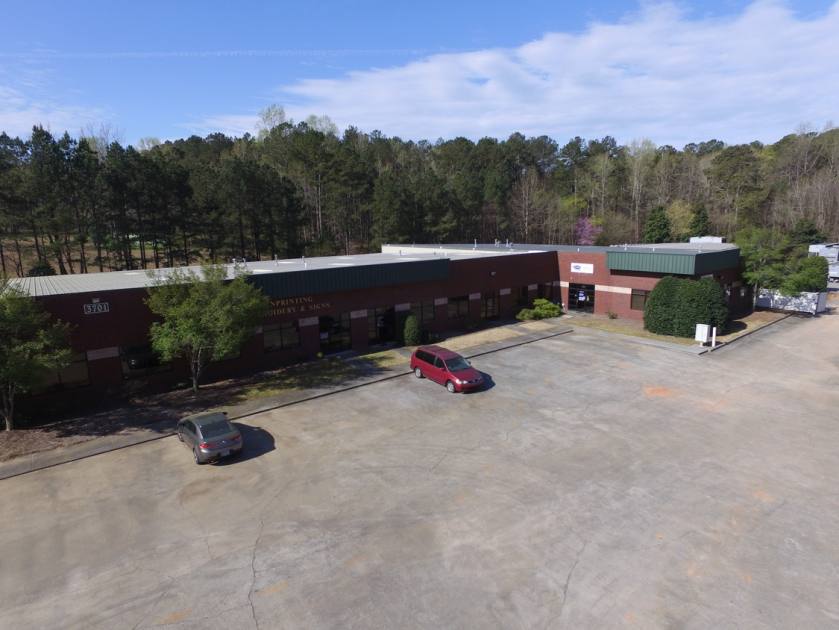
3701 New McEver Road Northwest Acworth, GA 30101
3701 New McEver Road Northwest Acworth, GA 30101
Details & Description
Property Highlights
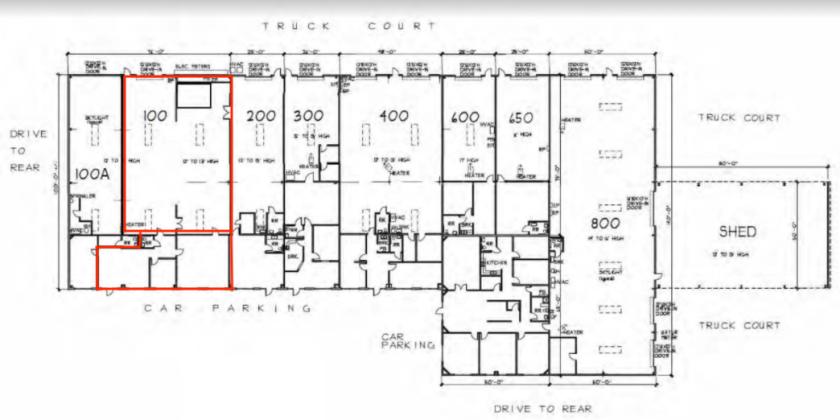
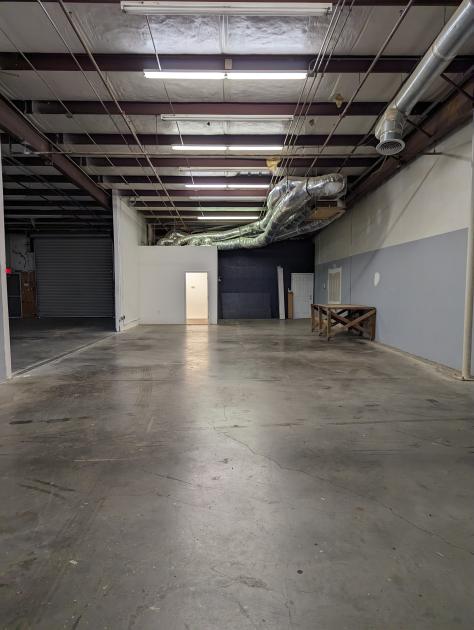
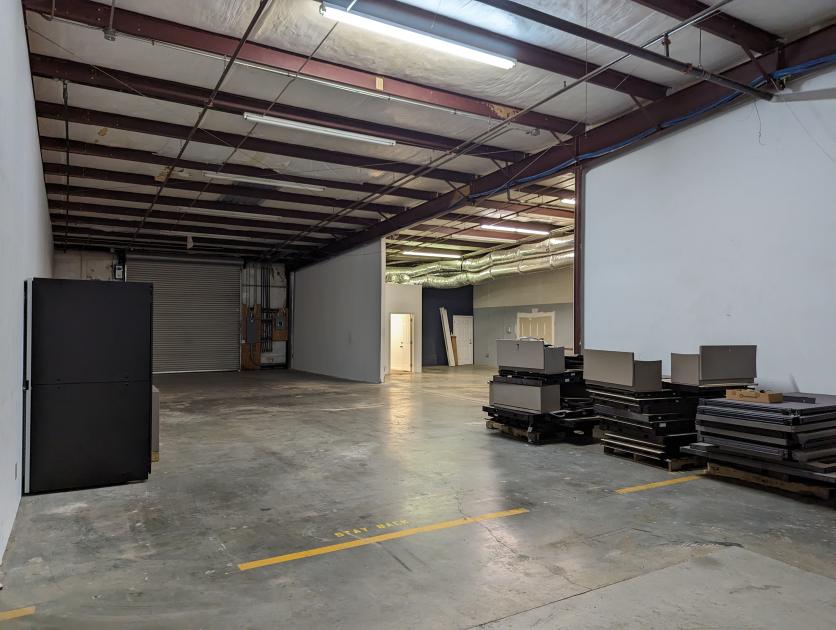
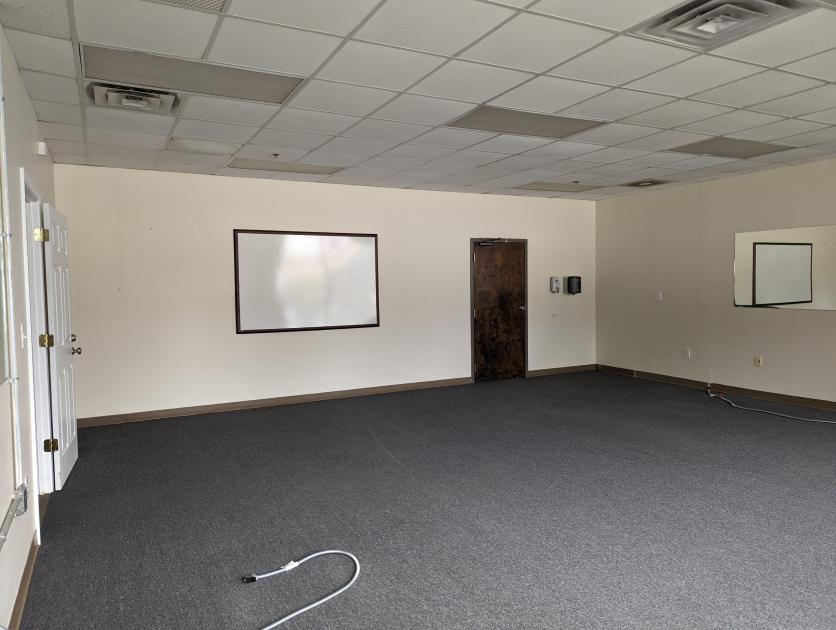
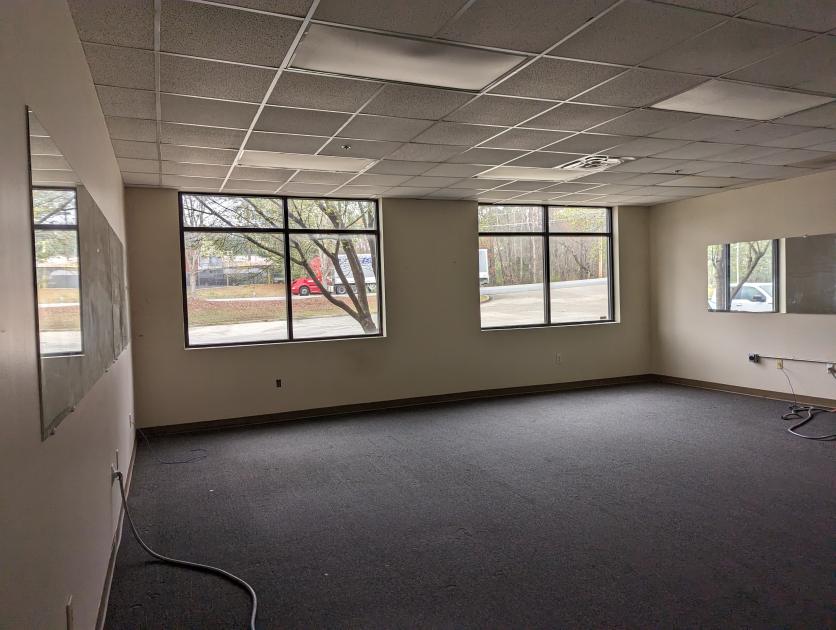
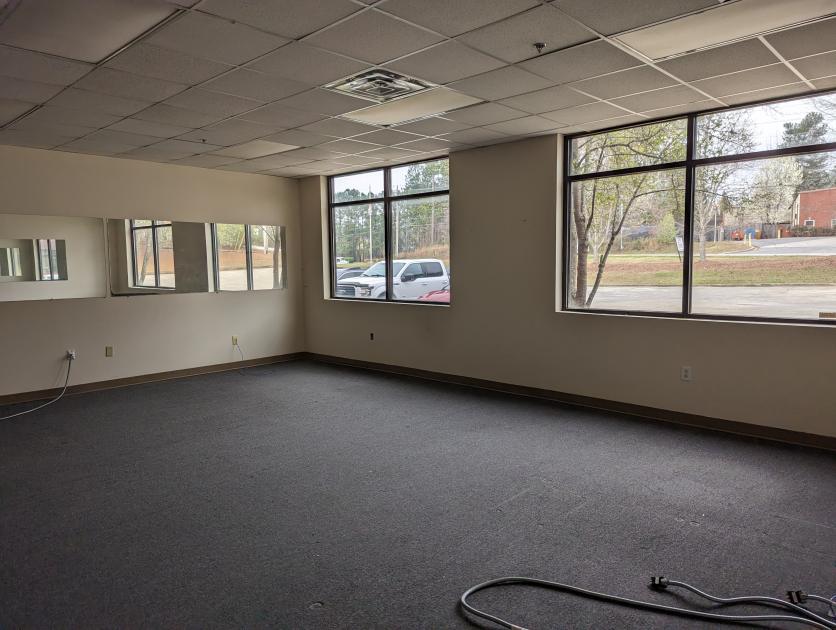
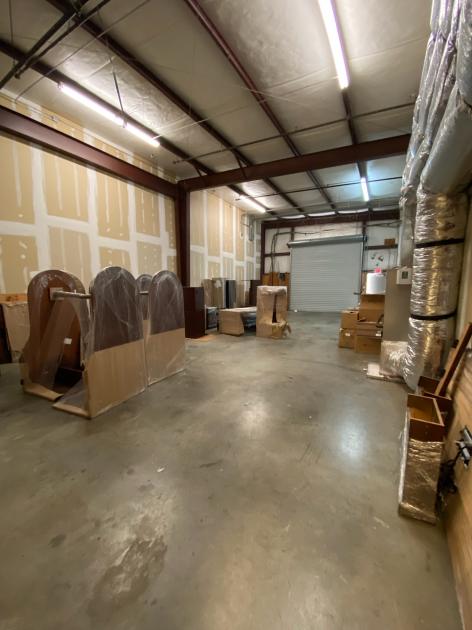
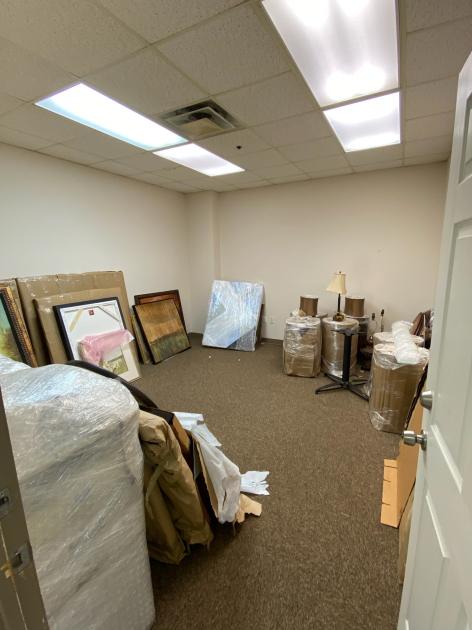
• 1,875 - 5,350 sf of light industrial space with a drive in door
• Conveniently located near I-75, US-41 and downtown Acworth
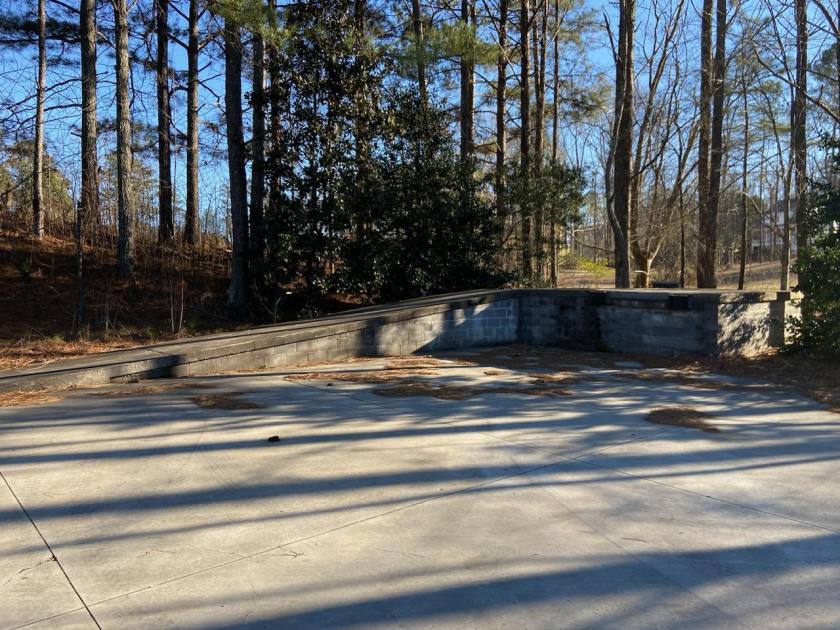
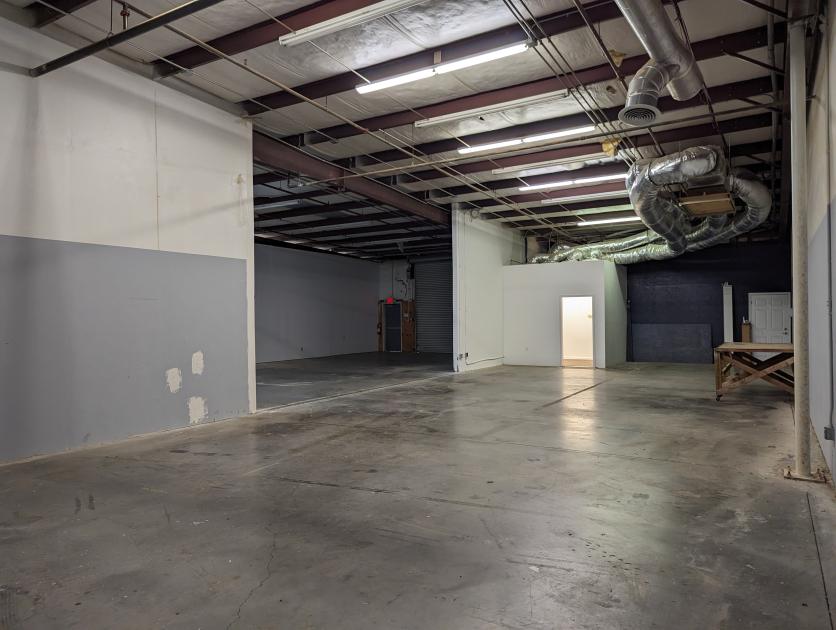
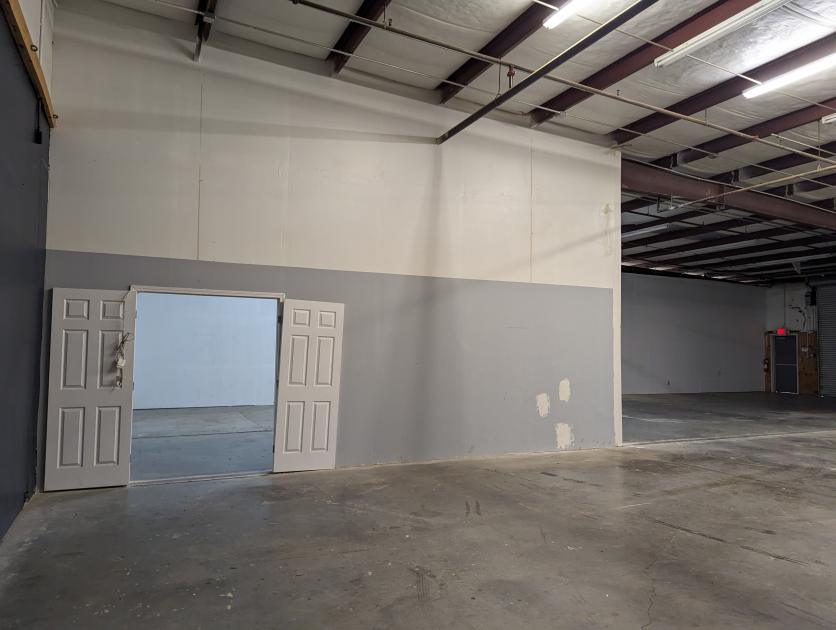
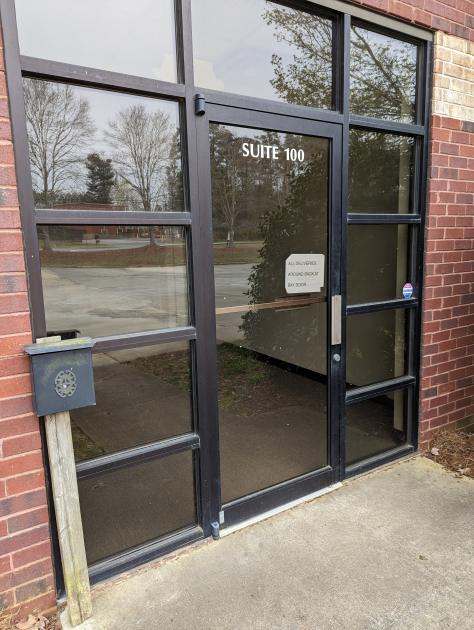
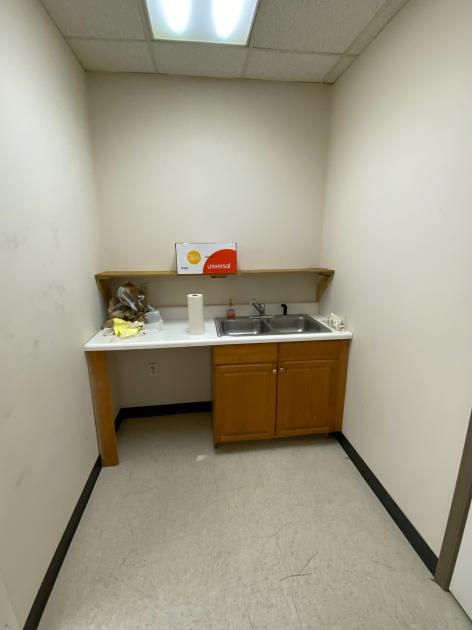
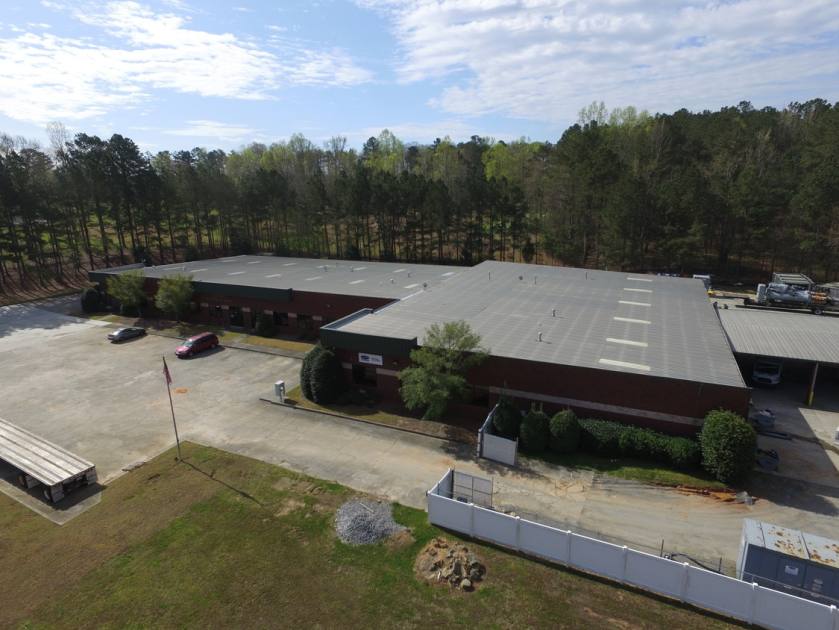
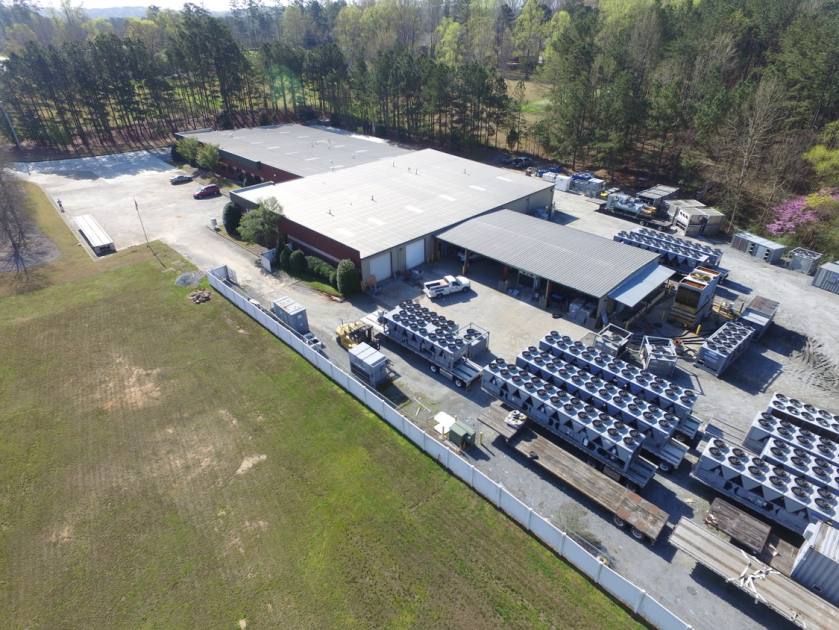
Additional Photos
Listing Agents

Donald Edwards Jr.
O: 678-298-1622
M: 770-324-3457
don@dbeproperties.com
O: 678-298-1622
M: 770-324-3457
don@dbeproperties.com
While we strive to provide the most accurate information, all listing information, and demographic data, is provided by third-parties. As such, MyEListing will not be responsible for the accuracy of the information. It is strongly recommended that you verify all information with the listing agent, and any relevant agencies, prior to making any decisions.